Control experiments#
What are the “control” parameters
What are the control experiments samples:
Comparison between the two first samples produced#
The first sample generated on the 09-15 only contain 3 steps at 130, 140 and 160K but the following sample produced on 09-16 has been submitted to a more classical heating ramp (40,60,80,100,120,130,140,160,180) with 30 minutes isotherm (2 scans). Fig. 60 show a comparison between those two samples at 3 temperatures (20K, 130K and 140K), before and after baseline correction (DR2).
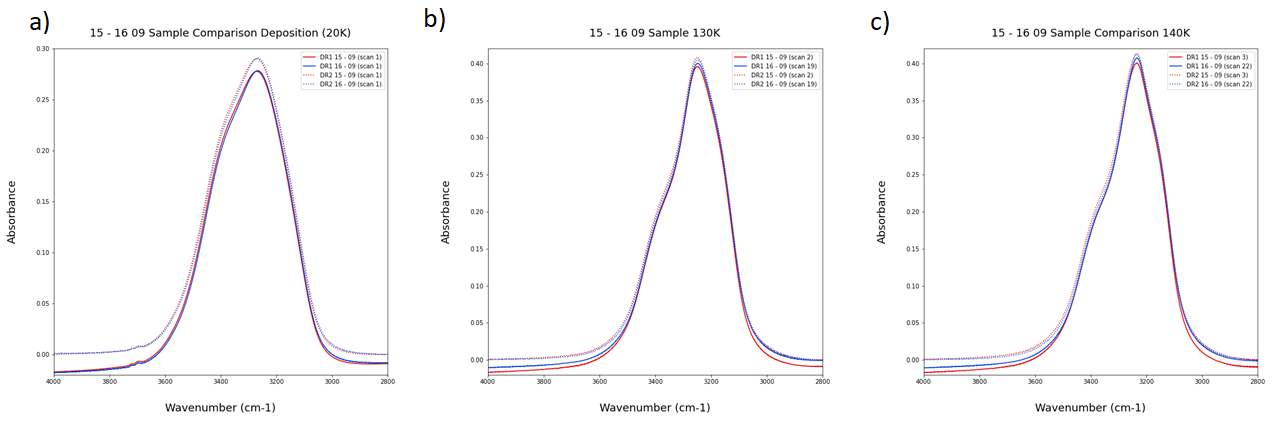
Fig. 60 Caption#
Figure 1 a) show that the two depositions are very similar, even though a slight red shift can be observed for the 16 – 09 sample (blue line) that is probably within the margin of error. This feature is still present after the baseline correction highlighting the reliability of this reduction method. It is interesting to notice that the baseline is very similar for the deposition of the two samples but is shifting towards higher absorbance for the 16-09 sample that has experienced a longer heating ramp. Figure 1b) show a slightly higher maximum absorption for the 15-09 sample whereas Figure 1c) show a similar maximum absorbance between the 2 samples but a “left shoulder” more pronounced on the 15-09 sample.
Note
To investigate:
Linear regression between the backgrounds of the 2 samples at each presented temperature (expected to have similar slope – same experimental conditions)
Compare the two deposition with thickness calculation to confirm thickness similarity.
Investigate background evolution for 16-09 sample between 20K and 130K
Subtract the 2 spectrums to investigate differences (redshift of 16-09 w/r 15-09)
The closest sample from the two presented above in term of experimental conditions of the deposition is the 28-09 sample, deposited at a base temperature of 21.6 K and a base pressure of 7 * 10-10 mbar.
Comparison between the 16-09 and 28-09 samples#
Same deposition time (20min), but less material deposited for 28-09 sample (Gas cell consumption inferior) leading to a slower deposition rate.
Note
How does sample thickness compare ?
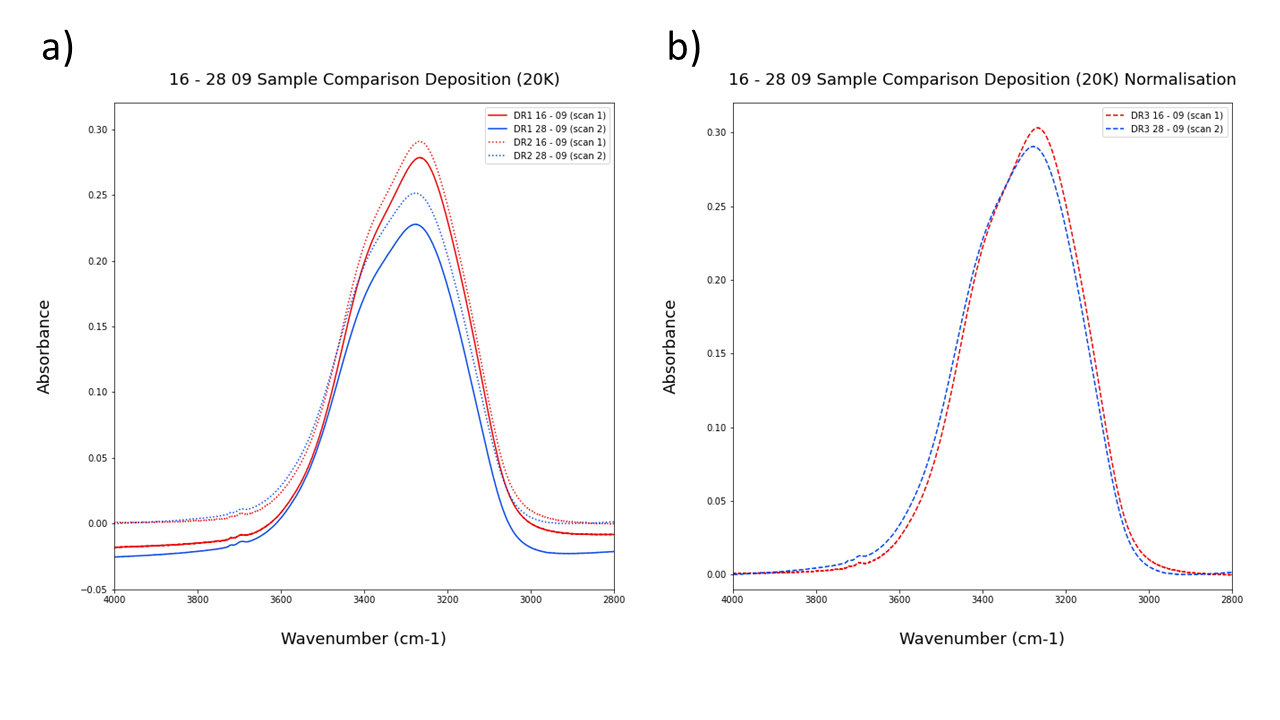
Fig. 61 Caption#
The 28-09 sample seems to be redshifted and have a lower maximal absorbance. If we assume that the broad OH feature is a combination of two main Gaussians (nominally left and right, the left one having an inferior maximum absorbance than the right), as can be observed on the crystalline samples, this effect can be explained by a favouring of the left configuration for slower deposition rates.
Gas flow deposition investigation#
09-17 has been deposited with a high flow rate of 10-6 mbar for 2min whereas 21-09 sample has been deposited for 3h20 at 10-8 mbar. Figure 3 show those two samples compared with 16-09.
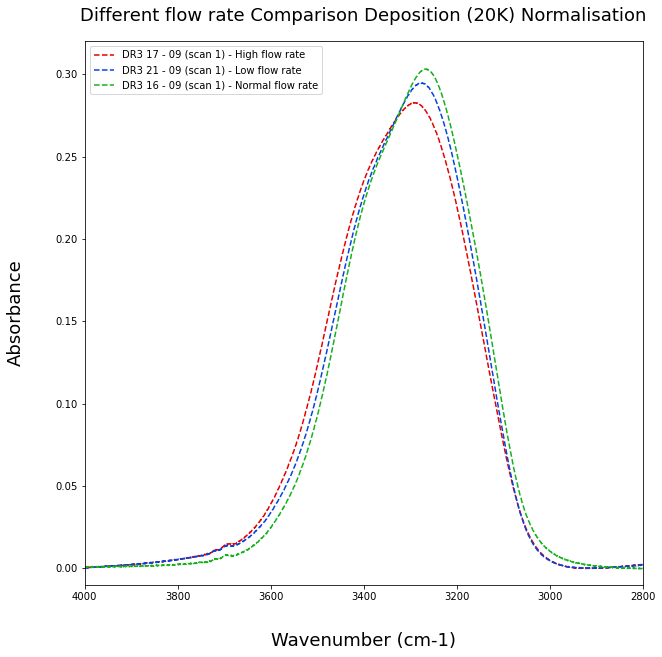
Fig. 62 Caption#
Fig. 62 show no apparent correlation between the flow rate and maximum absorbance shifting as postulated earlier. One explanation could be a thickness dependence. Investigating of the “gas cell consumption” parameter (i.e. the amount of water introduced into the chamber) doesn’t provide a reliable method of thickness measurement. Indeed, not all gas introduced is sticking on the target, and even though 16-09 and 17-09 have the same gas cell consumption (1.24 Torr), it is not possible at this stage to conclude about their relative thickness and further investigation will be performed using thickness calculation via Interferometry. Those 3 samples have the particularity to be submitted to the same heating ramp and it would be interesting to compare those sample at each temperature steps to see if this effect persist over the whole temperature ramp.
Effect of the temperature ramp on the deposition#
Before to cross compare the 3 previously mentioned samples at each temperature steps, let’s analyse our reference sample (16-09) at each temperature.
16-09 sample over the whole temperature range#

Fig. 63 Caption#
Fig. 63 represent the 16-09 sample upon the whole temperature ramp. I can identify 4 different regimes:
From 20 to 100K the overall maximum absorbance increases significantly (and more importantly between 40 and 60K). This effect is joined by a global red shifting (i.e. reduction of the left counterpart and increase of the right part of the spectrum at lower wavenumber). It is important to notice that the increase in absorbance below 3300 cm-1 is only effective at absorbance above 0.10 and has no influence on the further away red wing below 3100.
The next regime concerns the temperature steps between 100 and 130K. The overall maximum absorbance remains constant and very few changes can be observed (to confirm with subtraction spectra) except on the red wing below 3100 wavenumber and 0.10 Absorbance.
The biggest modification of the overall OH stretch occur between 130K and 140 where an important redshift can be observed (give quantitative information DR2_(date)_max_A). Alike the modifications in the first regime, an increase in absorbance is observed on the blue part of the OH stretch along with an increase in both red wings.
The final range concerns temperatures above 140K where desorption is observed. It is interesting to notice that on the ramp from 140 to 160K (scan 24), the overall maximum absorbance remains constant whereas the left shoulder decreases significantly while both right wings increase.
28-09 sample over the whole temperature range#
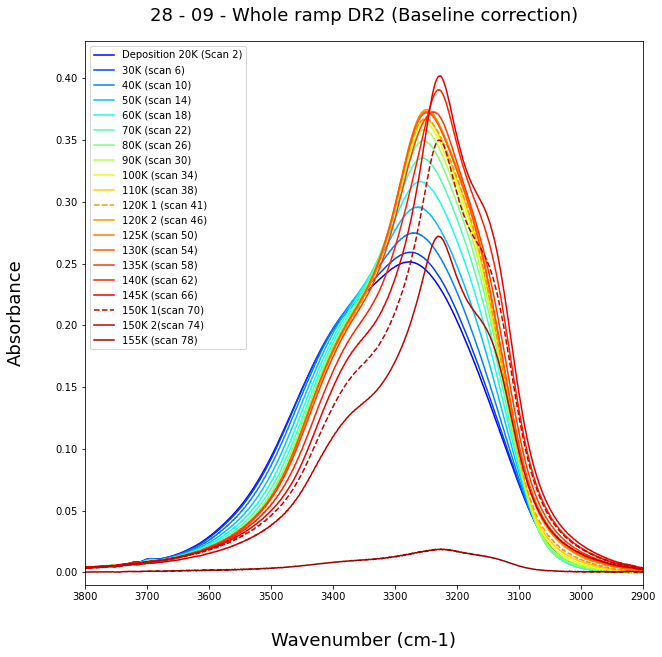
Fig. 64 Caption#
Fig. 64 show all the isotherms for the 28-09 samples. For a better vision, lets plot all the previously identified ranges on the same plots.
Range 1: 20 to 100K#

Fig. 65 Caption#
This temperature range correspond to the modification of the porous structure of ASW.
From SANS (Small Angle Neutron Scattering) data (unpublished – Sabrina Gaertner – Pierre Ghesquiere) reduction of micropores collapsing to form bigger pores.
We can observe an increase of the maximum absorbance accompanied with a slight redshift of the peak at each temperature steps reaching a maximum around 80 – 90K. This probably is a consequence of the left shoulder reduction for the benefit of the right shoulder.
Note that we can see a slight modification of the “tail” below 3050 cm-1 for temperature above 80K.
The 28-09 is submitted to a heating ramp of 1 hour (4 scans – 1 warm up (dotted line) and 3 isotherms, the first one being the dashed line and the third one represented by the plain line) for each temperatures. For this temperature range, the sample seems to take time to equilibrate as highlighted by the difference between the dashed and plain line, particularly at temperatures of 60 and 70K and this effect will be investigated with the 11-16 / 11-19 samples that have a longer isotherm at 60 and 70K.
Range 2: 100 to 130K#
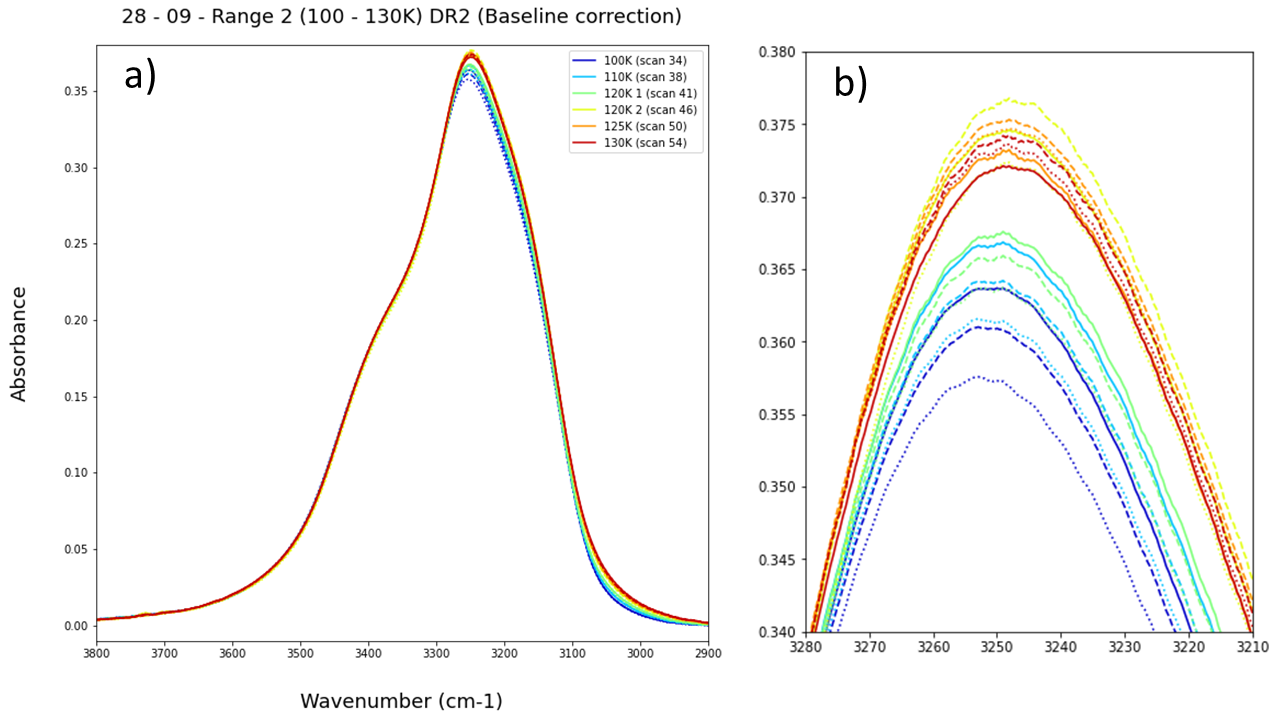
Fig. 66 Caption#
Increase in maximum overall maximum absorbance. Desorption observed during the warm-up scan. Influence on the right part of the spectrum (Is it Gaussian? – Looks more like Lorentzian distribution)
Range 3: 130 to 150K#
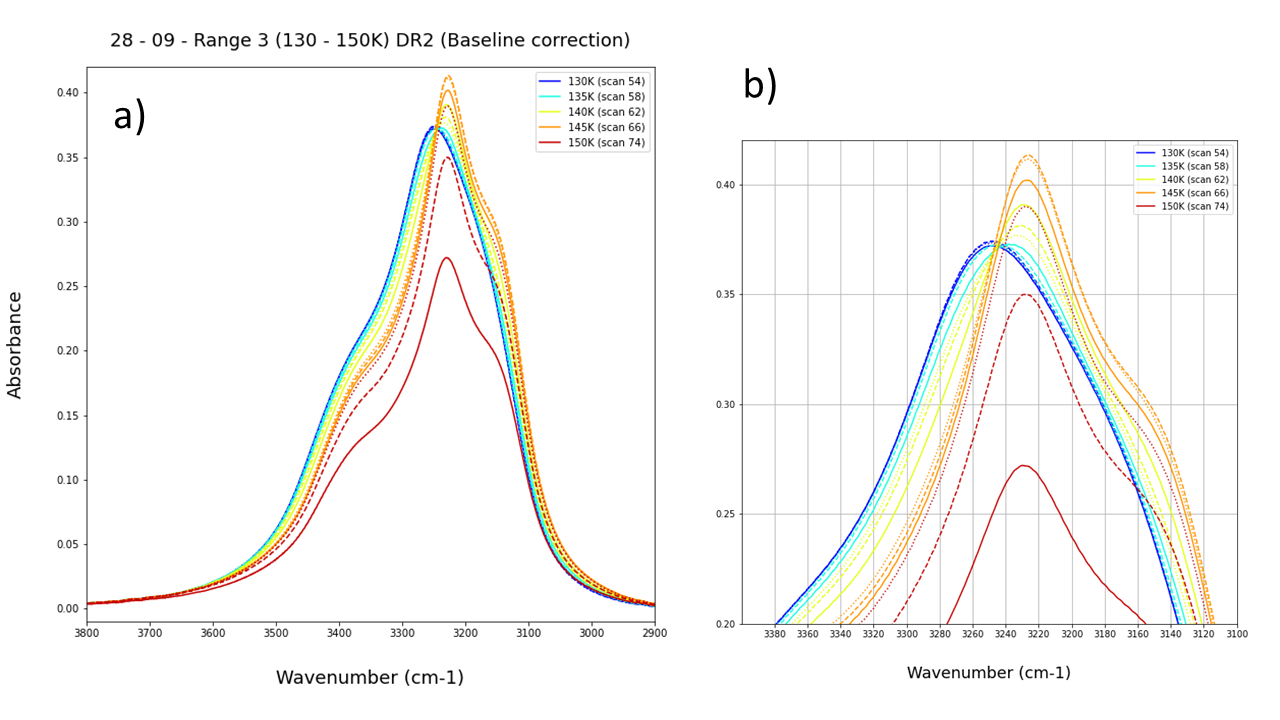
Fig. 67 Caption#
Redshift of the maximum absorbance peak is triggered at temperature of 135K but takes time to happen as no real change is observed for scans 55 and 56 (respectively dotted and dashed light blue curves) but visible for scan 58 (plein light blue curve) Desorption starts at 145 K
Range 4: Beyond 150K#
This range is indicative of ice desorption and is best interpreted using the OH stretch integration values (DR3_(date)_data_1_Int) rather than the actual spectroscopic data.
11-16 and 11-19 sample#
Those samples have been produced to study how long it takes for the sample to reach an “equilibrium state” after experiencing an annealing step. From 20K the samples have been brought up to 60K (with long isotherm achieved using OMNIC MACRO), and then at 70K to confirm the previous result. The Macro did not work for the 60K step of the 11-16 sample.
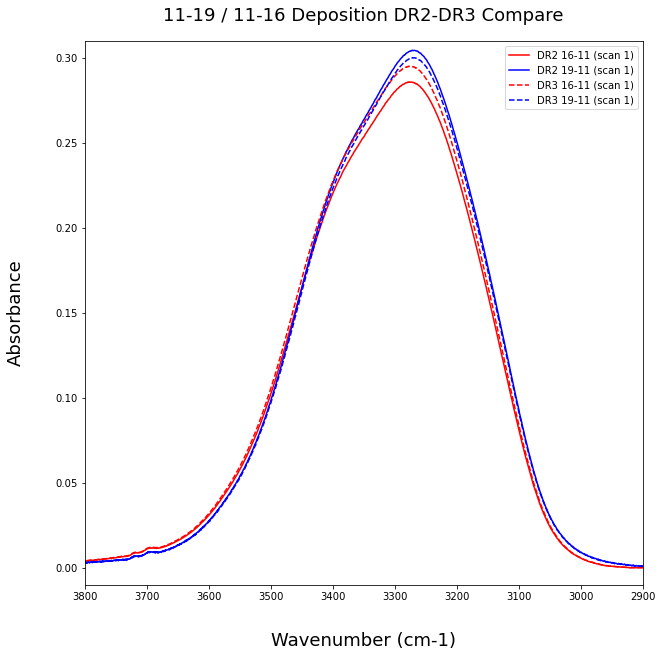
Fig. 68 Caption#
Fig. 68 show the deposition scans of samples 11-16 (red) and 11-19 (blue) submitted to baseline correction (DR2 – plain line), and normalisation. Some differences exist between the 2 samples, the 19-11 being redshifted with respect to the 11-16. The normalisation routine preserves those differences, this is a satisfactory result proving this reduction step is reliable.
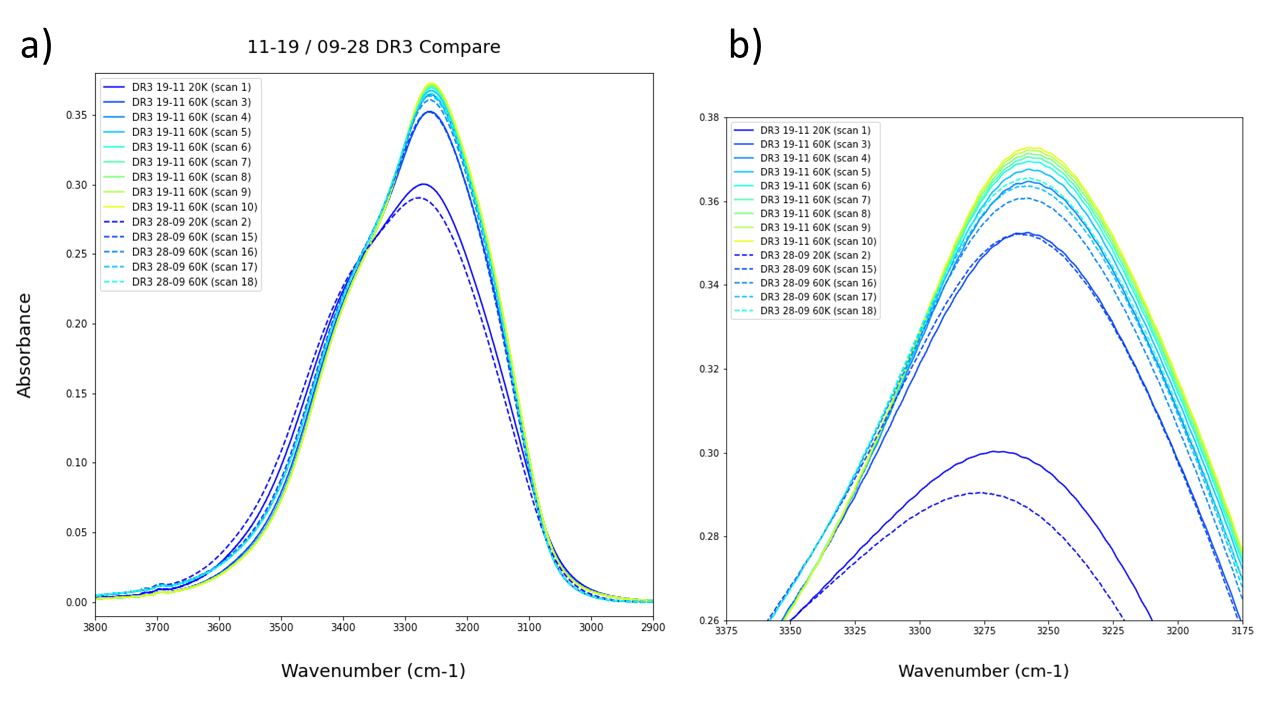
Fig. 69 Caption#
Fig. 69 shows that a minimum of 3 isothermal scans are required to reach a “pseudo equilibrium” where the inertia resulting from the annealing step is deeply reduced but not completely supressed. Figure 10 also show the 60K steps of the 28-09 sample (dashed lines). This confirm the previous result that there is not much difference between using a ramp or a step to get to a certain temperature (apart from the differences already observed for the depositions).
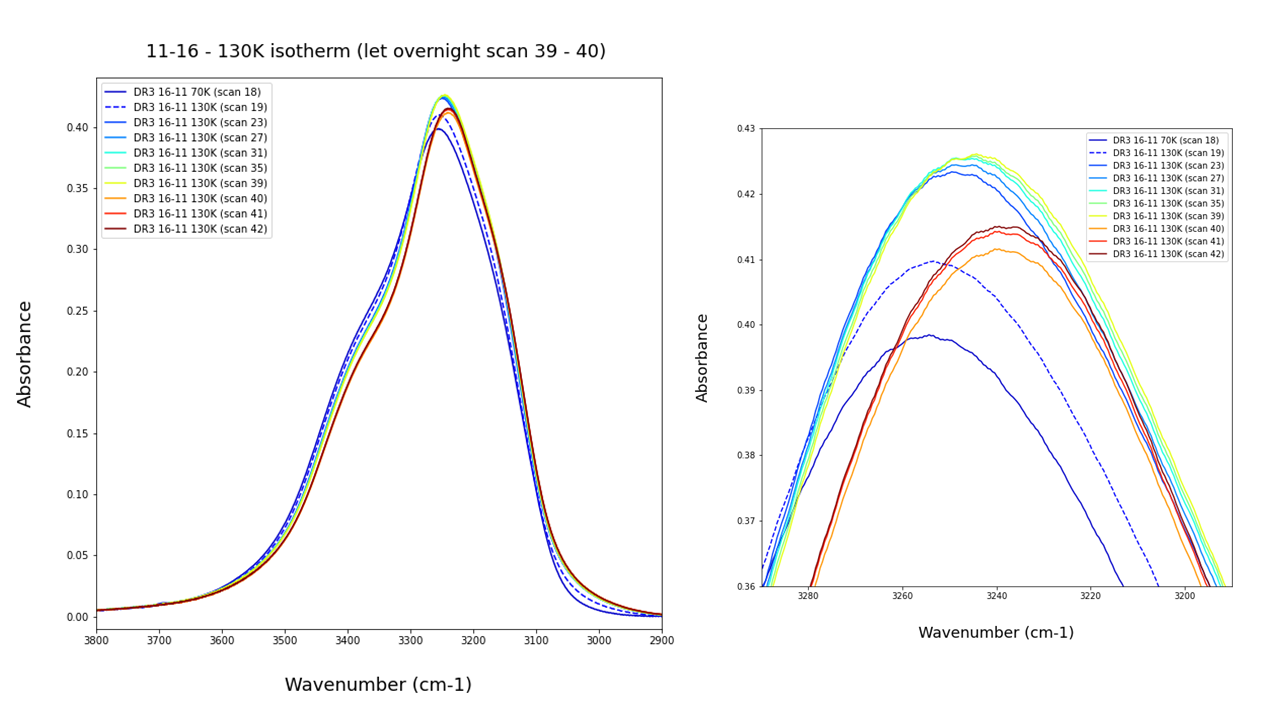
Fig. 70 Caption#
Fig. 70 show the 11-16 sample sitting at 130K. It is interesting to observe that big differences can be observe between the scan 49 and 50 where the ice has been sitting at 130K for a long time (How long exactly?). This suggest that some crystallisation is occurring well below the assume glass transition temperature. A deeper investigation of this process is required; thus, a dedicated sample need to be produced. Subtraction scans of such sample sitting at 130K should be the key to investigate the crystallisation processes of ASW. Furthermore samples sitting at 126, 128, 132, 134, 136 should unveil the kinetics of such a process.