DATA Processing
Contents
DATA Processing
The purpose of this Notebook is to perform the data processing steps for each sample:
DP1 : Substraction
DP2 : Gaussian fitting
One aim is to make this Notebook working within an html page and interactive using ipython widget
Workflow
#
To create (drag and drop image when produced)
Libraries
import numpy
import math
import matplotlib
import matplotlib.pyplot as plt
from matplotlib import cm
import pandas as pd
from glob import glob
from functools import reduce
import ipywidgets as widgets
import matplotlib.gridspec as gridspec
from ipywidgets import interact
import re
from cycler import cycler
import seaborn as sns
import matplotlib.gridspec as gridspec
import pylab

from lmfit.models import ExponentialModel, GaussianModel
%matplotlib
Using matplotlib backend: Qt5Agg
0 Input parameters
Not use (but here just in case)
Take time to describe method used with respect to previous Notebook (Improvement - Emphase on python teaching)
Sample type
# 0.1 Date

date = "2020_09_16"

# 0.2 XP
    # Can take value XP_1-1, XP_1-2

XP = "XP_1-1"

# 0.3 Sample type
    # Can take value ASW, C2H6, C2H6_ASW

spl = "ASW"
Sample annex
For quick sample comparison (max 3 sample named 2-3-4)
date2 = "2020_09_28"
date3 = "2020_09_17"
date4 = "2020_09_21"
\(\color{green}{\text{DP1 : Sample Checking}}\) 
1.1 DATA Import
The Data processing routine is performed per sample.
A date is set as input
from the previous data analysis, summarized in the following document below, we have identified 4 temeperature ranges where the sample undergo different physical processes.
XP1_Plan
So the purpose here is to chop the data with respect to those ranges before to perform the Substraction
Experimental ranges (in T):
Range 1: 20 - 100K
Range 2: 100 to 130K
Range 3: 130K - 140K
Range 4: Beyond 140K
I want to extract the temperature ramp info from XP Ramp:
1.1.1 XP-Ramp
XP_Ramp_df = pd.read_csv('D:\DATA-Processing\PAC\XP_list_test.csv')
XP_Ramp_df_I = XP_Ramp_df.set_index('Date')
#XP_Ramp_df_I.head(5)
1.1.2 DR1, DR2, DR3
DR1 (Date)
DR1_Allscan_df = pd.read_csv("D:\DATA-Processing\PAC\{}/Samples/{}/Data/DR/DR1_{}_All-scans.csv".format(XP,date,date))
DR1_Allscan_df = DR1_Allscan_df.T.iloc[1:].T
#DR1_Allscan_df
DR1 (Date Annex)
DR1_Allscan_df_2 = pd.read_csv("D:\DATA-Processing\PAC\{}/Samples/{}/Data/DR/DR1_{}_All-scans.csv".format(XP,date2,date2))
DR1_Allscan_df_3 = pd.read_csv("D:\DATA-Processing\PAC\{}/Samples/{}/Data/DR/DR1_{}_All-scans.csv".format(XP,date3,date3))
DR1_Allscan_df_4 = pd.read_csv("D:\DATA-Processing\PAC\{}/Samples/{}/Data/DR/DR1_{}_All-scans.csv".format(XP,date4,date4))


DR1_Allscan_df_2 = DR1_Allscan_df_2.T.iloc[1:].T
DR1_Allscan_df_3 = DR1_Allscan_df_3.T.iloc[1:].T
DR1_Allscan_df_4 = DR1_Allscan_df_4.T.iloc[1:].T
#DR1_Allscan_df_2
DR2 (Date)
DR2_Allscan_df = pd.read_csv('D:\DATA-Processing\PAC\{}/Samples/{}/Data/DR/DR2_{}_All-scans.csv'.format(XP, date, date))
DR2_Allscan_df = DR2_Allscan_df.T.iloc[1:].T
#DR2_Allscan_df
DR2 (Date Annex)
DR2_Allscan_df_2 = pd.read_csv('D:\DATA-Processing\PAC\{}/Samples/{}/Data/DR/DR2_{}_All-scans.csv'.format(XP, date2, date2))
DR2_Allscan_df_3 = pd.read_csv('D:\DATA-Processing\PAC\{}/Samples/{}/Data/DR/DR2_{}_All-scans.csv'.format(XP, date3, date3))
DR2_Allscan_df_4 = pd.read_csv('D:\DATA-Processing\PAC\{}/Samples/{}/Data/DR/DR2_{}_All-scans.csv'.format(XP, date4, date4))

DR2_Allscan_df_2 = DR2_Allscan_df_2.T.iloc[1:].T
DR2_Allscan_df_3 = DR2_Allscan_df_3.T.iloc[1:].T
DR2_Allscan_df_4 = DR2_Allscan_df_4.T.iloc[1:].T
#DR2_Allscan_df_2
DR3 (Date)
DR3_Allscan_df = pd.read_csv("D:\DATA-Processing\PAC\{}/Samples/{}/Data/DR/DR3_{}_A.csv".format(XP,date,date))
DR3_Allscan_df = DR3_Allscan_df.T.iloc[1:].T
#DR3_Allscan_df
DR3 (Date Annex)
DR3_Allscan_df_2 = pd.read_csv("D:\DATA-Processing\PAC\{}/Samples/{}/Data/DR/DR3_{}_A.csv".format(XP,date2,date2))
DR3_Allscan_df_3 = pd.read_csv("D:\DATA-Processing\PAC\{}/Samples/{}/Data/DR/DR3_{}_A.csv".format(XP,date3,date3))
DR3_Allscan_df_4 = pd.read_csv("D:\DATA-Processing\PAC\{}/Samples/{}/Data/DR/DR3_{}_A.csv".format(XP,date4,date4))

DR3_Allscan_df_2 = DR3_Allscan_df_2.T.iloc[1:].T
DR3_Allscan_df_3 = DR3_Allscan_df_3.T.iloc[1:].T
DR3_Allscan_df_4 = DR3_Allscan_df_4.T.iloc[1:].T
1.3 Data_annex
1.2.1 Import
#Date

data_anex_df = pd.read_csv("D:\DATA-Processing\PAC\{}/Samples/{}/Data/DR/{}_data_annex.csv".format(XP,date,date))

#Date Annex

data_anex_df_2 = pd.read_csv("D:\DATA-Processing\PAC\{}/Samples/{}/Data/DR/{}_data_annex.csv".format(XP,date2,date2))
data_anex_df_3 = pd.read_csv("D:\DATA-Processing\PAC\{}/Samples/{}/Data/DR/{}_data_annex.csv".format(XP,date3,date3))
data_anex_df_4 = pd.read_csv("D:\DATA-Processing\PAC\{}/Samples/{}/Data/DR/{}_data_annex.csv".format(XP,date4,date4))
data_anex_df
| Name | min1 | index1 | min2 | index2 | min3 | index3 | min4 | index4 | min5 | ... | maxA0w | maxBi | maxB | maxBw | maxCi | maxC | maxCw | Int_A | Int_C | Int_N_A | |
|---|---|---|---|---|---|---|---|---|---|---|---|---|---|---|---|---|---|---|---|---|---|
| 0 | ASW_2020_09_16_1 | -0.018844 | 6636 | -0.008464 | 4235 | -0.008369 | 4139 | -0.001418 | 2403 | -0.000786 | ... | 3268.321 | 2945 | 0.009284 | 2219.700 | 1773 | 0.023557 | 1654.651 | 95.913079 | 6.952239 | 100.000000 |
| 1 | ASW_2020_09_16_2 | -0.017376 | 6636 | -0.006804 | 4235 | -0.006714 | 4139 | 0.000216 | 2432 | 0.000863 | ... | 3264.464 | 2945 | 0.009251 | 2219.700 | 1771 | 0.023602 | 1653.686 | 96.271574 | 7.064048 | 100.373772 |
| 2 | ASW_2020_09_16_3 | -0.015208 | 6636 | -0.005247 | 4197 | -0.005165 | 4130 | 0.001310 | 2413 | 0.001796 | ... | 3264.464 | 2947 | 0.010343 | 2220.665 | 1754 | 0.024362 | 1645.490 | 98.372535 | 7.669780 | 102.564255 |
| 3 | ASW_2020_09_16_4 | -0.014749 | 6631 | -0.004931 | 4197 | -0.004867 | 4130 | 0.001626 | 2413 | 0.002152 | ... | 3264.464 | 2947 | 0.010512 | 2220.665 | 1754 | 0.024289 | 1645.490 | 98.949916 | 7.710412 | 103.166239 |
| 4 | ASW_2020_09_16_5 | -0.014274 | 6620 | -0.004424 | 4245 | -0.004362 | 4130 | 0.002212 | 2413 | 0.002702 | ... | 3264.464 | 2947 | 0.010562 | 2220.665 | 1754 | 0.024293 | 1645.490 | 99.128959 | 7.740047 | 103.352911 |
| 5 | ASW_2020_09_16_6 | -0.013616 | 6636 | -0.003845 | 4235 | -0.003754 | 4139 | 0.003361 | 2444 | 0.003725 | ... | 3255.303 | 2949 | 0.010078 | 2221.629 | 1756 | 0.023139 | 1646.454 | 102.427355 | 8.047927 | 106.791854 |
| 6 | ASW_2020_09_16_7 | -0.013178 | 6632 | -0.003492 | 4235 | -0.003383 | 4139 | 0.003972 | 2425 | 0.004340 | ... | 3255.303 | 2951 | 0.010252 | 2222.593 | 1756 | 0.022505 | 1646.454 | 103.570509 | 8.057326 | 107.983719 |
| 7 | ASW_2020_09_16_8 | -0.012907 | 6632 | -0.003190 | 4235 | -0.003086 | 4139 | 0.004323 | 2406 | 0.004697 | ... | 3255.303 | 2951 | 0.010345 | 2222.593 | 1756 | 0.022478 | 1646.454 | 103.920588 | 8.069566 | 108.348714 |
| 8 | ASW_2020_09_16_9 | -0.013285 | 6636 | -0.002969 | 4245 | -0.002883 | 4139 | 0.004149 | 2415 | 0.004730 | ... | 3251.446 | 2959 | 0.011390 | 2226.450 | 1754 | 0.022548 | 1645.490 | 106.316388 | 8.023931 | 110.846602 |
| 9 | ASW_2020_09_16_10 | -0.013301 | 6636 | -0.002779 | 4216 | -0.002666 | 4139 | 0.004334 | 2367 | 0.004952 | ... | 3251.446 | 2959 | 0.011787 | 2226.450 | 1754 | 0.022958 | 1645.490 | 107.623907 | 8.026164 | 112.209835 |
| 10 | ASW_2020_09_16_11 | -0.013018 | 6636 | -0.002502 | 4197 | -0.002379 | 4120 | 0.004644 | 2367 | 0.005298 | ... | 3250.482 | 2959 | 0.011822 | 2226.450 | 1754 | 0.022904 | 1645.490 | 107.980853 | 8.037065 | 112.581991 |
| 11 | ASW_2020_09_16_12 | -0.012113 | 6636 | -0.002024 | 4149 | -0.001986 | 4130 | 0.005265 | 2415 | 0.005871 | ... | 3251.446 | 2959 | 0.011693 | 2226.450 | 1754 | 0.020700 | 1645.490 | 108.386906 | 8.033410 | 113.005345 |
| 12 | ASW_2020_09_16_13 | -0.011900 | 6636 | -0.001360 | 4151 | -0.001341 | 4132 | 0.005725 | 2367 | 0.006299 | ... | 3250.482 | 2980 | 0.012006 | 2236.575 | 1771 | 0.021517 | 1653.686 | 109.276611 | 8.503723 | 113.932962 |
| 13 | ASW_2020_09_16_14 | -0.011673 | 6636 | -0.001157 | 4151 | -0.001115 | 4130 | 0.005912 | 2415 | 0.006504 | ... | 3250.482 | 2959 | 0.011885 | 2226.450 | 1771 | 0.021516 | 1653.686 | 109.502264 | 8.477687 | 114.168230 |
| 14 | ASW_2020_09_16_15 | -0.011645 | 6636 | -0.001251 | 4149 | -0.001226 | 4139 | 0.006022 | 2415 | 0.006723 | ... | 3250.482 | 2966 | 0.011713 | 2229.825 | 1699 | 0.020339 | 1618.973 | 109.378492 | 8.007280 | 114.039184 |
| 15 | ASW_2020_09_16_16 | -0.011338 | 6636 | -0.000905 | 4168 | -0.000901 | 4139 | 0.006207 | 2415 | 0.006852 | ... | 3247.107 | 2964 | 0.012078 | 2228.861 | 1769 | 0.020189 | 1652.722 | 109.838625 | 8.093852 | 114.518923 |
| 16 | ASW_2020_09_16_17 | -0.011244 | 6636 | -0.000821 | 4149 | -0.000807 | 4139 | 0.006330 | 2415 | 0.006958 | ... | 3247.107 | 2964 | 0.012166 | 2228.861 | 1769 | 0.020213 | 1652.722 | 110.041893 | 8.142568 | 114.730852 |
| 17 | ASW_2020_09_16_18 | -0.011332 | 6636 | -0.000989 | 4149 | -0.001025 | 4130 | 0.006762 | 2480 | 0.007738 | ... | 3246.625 | 2957 | 0.011663 | 2225.486 | 1754 | 0.021377 | 1645.490 | 109.763420 | 7.476483 | 114.440514 |
| 18 | ASW_2020_09_16_19 | -0.010872 | 6636 | -0.000882 | 4158 | -0.000914 | 4130 | 0.006530 | 2480 | 0.008113 | ... | 3246.625 | 2978 | 0.011855 | 2235.610 | 1697 | 0.021481 | 1618.009 | 109.666245 | 7.569996 | 114.339198 |
| 19 | ASW_2020_09_16_20 | -0.010809 | 6636 | -0.000910 | 4149 | -0.000942 | 4130 | 0.006549 | 2480 | 0.008185 | ... | 3246.143 | 2978 | 0.011966 | 2235.610 | 1697 | 0.021457 | 1618.009 | 109.738473 | 7.560006 | 114.414504 |
| 20 | ASW_2020_09_16_21 | -0.011159 | 6636 | -0.001222 | 4151 | -0.001287 | 4103 | 0.006266 | 2415 | 0.007035 | ... | 3242.286 | 2966 | 0.012110 | 2229.825 | 1699 | 0.020884 | 1618.973 | 109.665610 | 8.124397 | 114.338537 |
| 21 | ASW_2020_09_16_22 | -0.010915 | 6630 | -0.001349 | 4151 | -0.001461 | 4111 | 0.006305 | 2444 | 0.007058 | ... | 3232.161 | 2976 | 0.012184 | 2234.646 | 1535 | 0.020529 | 1539.905 | 109.891203 | 8.369954 | 114.573742 |
| 22 | ASW_2020_09_16_23 | -0.010836 | 6630 | -0.001540 | 4151 | -0.001650 | 4084 | 0.006335 | 2396 | 0.007176 | ... | 3228.304 | 2976 | 0.012485 | 2234.646 | 1535 | 0.020793 | 1539.905 | 110.395286 | 8.440394 | 115.099305 |
| 23 | ASW_2020_09_16_24 | -0.014164 | 6636 | -0.006225 | 4149 | -0.006255 | 4101 | 0.003633 | 2444 | 0.004862 | ... | 3228.304 | 2976 | 0.011491 | 2234.646 | 1697 | 0.019248 | 1618.009 | 108.090993 | 7.265889 | 112.696823 |
| 24 | ASW_2020_09_16_25 | -0.013780 | 6636 | -0.008598 | 4151 | -0.008599 | 4122 | 0.001659 | 2484 | 0.002442 | ... | 3228.304 | 2978 | 0.008953 | 2235.610 | 1535 | 0.016275 | 1539.905 | 83.840839 | 5.785232 | 87.413354 |
| 25 | ASW_2020_09_16_26 | 0.002459 | 6636 | 0.004937 | 4151 | 0.004895 | 4053 | 0.006344 | 2329 | 0.006488 | ... | 3227.822 | 2978 | 0.004050 | 2235.610 | 1535 | 0.009392 | 1539.905 | 27.229288 | 2.969525 | 28.389547 |
| 26 | ASW_2020_09_16_27 | 0.007303 | 6636 | 0.007753 | 4533 | 0.008098 | 3959 | 0.007518 | 2300 | 0.007247 | ... | 3228.304 | 2295 | 0.001530 | 1906.319 | 1495 | 0.004807 | 1520.620 | 3.170572 | 1.399266 | 3.305672 |
| 27 | ASW_2020_09_16_28 | 0.007890 | 6332 | 0.008135 | 4545 | 0.008503 | 4139 | 0.008035 | 2480 | 0.007282 | ... | 3242.286 | 2698 | 0.001674 | 2100.615 | 1495 | 0.006589 | 1520.620 | 2.966754 | 1.841489 | 3.093169 |
| 28 | ASW_2020_09_16_29 | 0.008264 | 6332 | 0.008545 | 4563 | 0.008896 | 4139 | 0.008449 | 2480 | 0.007719 | ... | 3242.286 | 2698 | 0.001720 | 2100.615 | 1495 | 0.006580 | 1520.620 | 3.023007 | 1.840784 | 3.151819 |
| 29 | ASW_2020_09_16_30 | 0.008619 | 6331 | 0.008641 | 4562 | 0.009109 | 4084 | 0.008596 | 2480 | 0.008381 | ... | 3228.304 | 2602 | 0.001573 | 2054.332 | 1574 | 0.004599 | 1558.708 | 3.025809 | 1.338555 | 3.154741 |
| 30 | ASW_2020_09_16_31 | 0.008318 | 6636 | 0.008889 | 4543 | 0.009277 | 3959 | 0.008351 | 2461 | 0.008204 | ... | 3223.965 | 2437 | 0.002416 | 1974.781 | 1495 | 0.006633 | 1520.620 | 3.256800 | 1.924223 | 3.395574 |
31 rows × 31 columns
#data_anex_df = data_anex_df.T.iloc[1:].T
#data_anex_df_2 = data_anex_df_2.T.iloc[1:].T
#data_anex_df_3 = data_anex_df_3.T.iloc[1:].T
#data_anex_df_4 = data_anex_df_4.T.iloc[1:].T
data_anex_df_2
| Name | min1 | index1 | min2 | index2 | min3 | index3 | min4 | index4 | min5 | ... | maxA0w | maxBi | maxB | maxBw | maxCi | maxC | maxCw | Int_A | Int_C | Int_N_A | |
|---|---|---|---|---|---|---|---|---|---|---|---|---|---|---|---|---|---|---|---|---|---|
| 0 | ASW_2020_09_28_1 | -0.026504 | 6620 | -0.024226 | 4401 | -0.022407 | 4134 | -0.009105 | 2458 | -0.007995 | ... | 3272.178 | 2923 | 0.009211 | 2209.094 | 1780 | 0.022529 | 1658.026 | 86.558093 | 6.591012 | 100.000000 |
| 1 | ASW_2020_09_28_2 | -0.025427 | 6636 | -0.022822 | 4372 | -0.021184 | 4144 | -0.007454 | 2477 | -0.006254 | ... | 3276.035 | 2942 | 0.007386 | 2218.254 | 1771 | 0.019989 | 1653.686 | 86.043652 | 5.563222 | 99.405669 |
| 2 | ASW_2020_09_28_3 | -0.024675 | 6636 | -0.021948 | 4401 | -0.020278 | 4142 | -0.006614 | 2477 | -0.005435 | ... | 3276.035 | 2942 | 0.007681 | 2218.254 | 1771 | 0.020173 | 1653.686 | 86.876902 | 5.599657 | 100.368318 |
| 3 | ASW_2020_09_28_4 | -0.024353 | 6632 | -0.021656 | 4393 | -0.019961 | 4142 | -0.006287 | 2477 | -0.005064 | ... | 3271.213 | 2923 | 0.007746 | 2209.094 | 1771 | 0.020165 | 1653.686 | 87.117734 | 5.607032 | 100.646549 |
| 4 | ASW_2020_09_28_5 | -0.024163 | 6632 | -0.021448 | 4401 | -0.019691 | 4134 | -0.005975 | 2458 | -0.004768 | ... | 3276.035 | 2942 | 0.007936 | 2218.254 | 1771 | 0.020096 | 1653.686 | 87.298165 | 5.540918 | 100.855000 |
| ... | ... | ... | ... | ... | ... | ... | ... | ... | ... | ... | ... | ... | ... | ... | ... | ... | ... | ... | ... | ... | ... |
| 75 | ASW_2020_09_28_76 | 0.033360 | 6633 | 0.035411 | 4154 | 0.035383 | 4135 | 0.040743 | 2479 | 0.041975 | ... | 3226.858 | 2990 | 0.005160 | 2241.396 | 1675 | 0.008315 | 1607.402 | 40.624815 | 2.506664 | 46.933584 |
| 76 | ASW_2020_09_28_77 | 0.039784 | 6633 | 0.040950 | 4154 | 0.040848 | 4077 | 0.043054 | 2479 | 0.043847 | ... | 3225.894 | 3040 | 0.003348 | 2265.502 | 1675 | 0.006200 | 1607.402 | 22.869835 | 1.940948 | 26.421371 |
| 77 | ASW_2020_09_28_78 | 0.043527 | 6335 | 0.043778 | 4163 | 0.043654 | 3962 | 0.043991 | 2345 | 0.043920 | ... | 3224.929 | 2300 | 0.002073 | 1908.730 | 947 | 0.005038 | 1256.416 | 5.198979 | 2.124355 | 6.006347 |
| 78 | ASW_2020_09_28_79 | 0.043639 | 6638 | 0.043704 | 4557 | 0.044042 | 3943 | 0.044228 | 2345 | 0.044163 | ... | 3224.929 | 2321 | 0.002171 | 1918.855 | 947 | 0.005697 | 1256.416 | 3.493992 | 2.447063 | 4.036586 |
| 79 | ASW_2020_09_28_80 | 0.016138 | 6633 | 0.020018 | 4211 | 0.020286 | 4136 | 0.033108 | 2489 | 0.034497 | ... | 3248.072 | 3037 | 0.011578 | 2264.056 | 1698 | 0.018059 | 1618.491 | 102.387413 | 7.200944 | 118.287510 |
80 rows × 31 columns
Purpose of this section is to perform a deep analysis of the sample with respect to the temperature ramp as for example,
plots various scans at different temperature, identify various range of interest.
perform linear regression of desorption data
average scans when isotherm ?
1.2 DATA Cleaning
1.2.1 Annealing scan supression and averaging of the isotherms ?
1.2.2 Error Analysis
After having avaeraged the scan previously, the purpose of this section is to identify the potential sources of errors and to generate error bars for the data accordingly
1.2 DATA Compare
1.2.1 MaxA
Prepare two dictionnaries
Dict 1
16-09
i = [0,1,4,7,10,13,16,19,22,25]
j = ["Dep","20","40","60","80","100","120","130","140","160"]

Td = dict(zip(j, i))

nscanTd = len(list(data_anex_df.index.values.tolist()))

print(nscanTd)
print(Td)
31
{'Dep': 0, '20': 1, '40': 4, '60': 7, '80': 10, '100': 13, '120': 16, '130': 19, '140': 22, '160': 25}
Dict 2
28-09
i = [0,1,8,16,24,32,40,52,60,79]
j = ["Dep","20","40","60","80","100","120","130","140","160"]

T2d = dict(zip(j, i))

nscanT2d = len(list(data_anex_df_2.index.values.tolist()))

print(nscanT2d)
print(T2d)
80
{'Dep': 0, '20': 1, '40': 8, '60': 16, '80': 24, '100': 32, '120': 40, '130': 52, '140': 60, '160': 79}
Plot
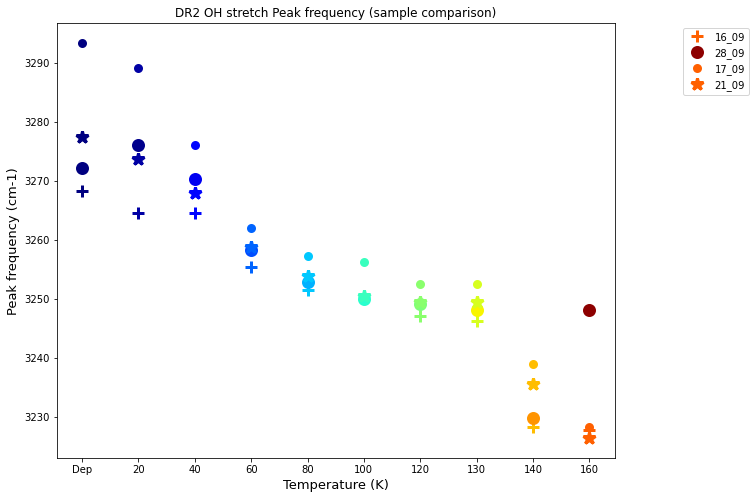
Peak frequency shift
fig= plt.figure(figsize=(10,8))

for (k,v), (k2,v2) in zip(Td.items(), T2d.items()):

    spl1, = plt.plot(k, data_anex_df.iloc[v,17], '+', mew=3, ms=12, c=cm.jet(v/nscanTd), label= "16_09")
    spl2, = plt.plot(k2, data_anex_df_2.iloc[v2,17], 'o', mew=3, ms=10, c=cm.jet(v2/nscanT2d), label= "28_09")
    spl3, = plt.plot(k, data_anex_df_3.iloc[v,17], '.', mew=3, ms=12, c=cm.jet(v/nscanTd), label= "17_09")
    spl4, = plt.plot(k, data_anex_df_4.iloc[v,17], '*', mew=3, ms=12, c=cm.jet(v/nscanTd), label= "21_09")

plt.title('DR2 OH stretch Peak frequency (sample comparison)')
#plt.axis([3210,3270])
plt.xlabel('Temperature (K)').set_fontsize(13)
plt.ylabel('Peak frequency (cm-1)').set_fontsize(13)
#ax = fig.gca()
#plt.grid()
#plt.legend()
plt.legend([spl1, spl2, spl3, spl4], ["16_09", "28_09", "17_09", "21_09"],bbox_to_anchor =(1.25, 1),)

#plt.savefig('D:\DATA-Processing\PAC\{}/Compare/DR2_{}_{}_PeakA-frequency.png'.format(XP, date, date2))

plt.show()
Integration from normalized data
fig= plt.figure(figsize=(10,8))

for (k,v), (k2,v2) in zip(Td.items(), T2d.items()):

    spl1, = plt.plot(k, data_anex_df.iloc[v,30], '+', mew=3, ms=12, c=cm.jet(v/nscanTd), label= "16_09")
    spl2, = plt.plot(k2, data_anex_df_2.iloc[v2,30], 'o', mew=3, ms=10, c=cm.jet(v2/nscanT2d), label= "28_09")
    spl3, = plt.plot(k, data_anex_df_3.iloc[v,30], '.', mew=3, ms=12, c=cm.jet(v/nscanTd), label= "17_09")
    spl4, = plt.plot(k, data_anex_df_4.iloc[v,30], '*', mew=3, ms=12, c=cm.jet(v/nscanTd), label= "21_09")

plt.title('DR2 OH stretch Integration value (sample comparison)')
#plt.axis([3210,3270])
plt.xlabel('Temperature (K)').set_fontsize(13)
plt.ylabel('Integration (AU)').set_fontsize(13)
#ax = fig.gca()
#plt.grid()
#plt.legend()
plt.legend([spl1, spl2, spl3, spl4], ["16_09", "28_09", "17_09", "21_09"])

#plt.savefig('D:\DATA-Processing\PAC\{}/Compare/DR2_{}_{}_PeakA-frequency.png'.format(XP, date, date2))

plt.show()
1.3 Data chopping
1.3.1 Temperature list splitting
Temp = XP_Ramp_df_I.columns[1:].values.tolist()
Temp
['20K ',
 '30K',
 '40K',
 '50K',
 '60K',
 '70K',
 '80K',
 '90K',
 '100K',
 '110K',
 '120K',
 '125K',
 '130K',
 '132K',
 '134K',
 '135K',
 '136K',
 '137K',
 '138K',
 '140K',
 '142K',
 '145K',
 '150K',
 '155K',
 '160K',
 '180K',
 '200K']
iterate through temp and recover scan number value for T in range 1,2,3,4
T1 = Temp[0:9]
T2 = Temp[8:13]
T3 = Temp[12:20]
T4 = Temp[19:26]
Sanity Check
T2
['100K', '110K', '120K', '125K', '130K']
1.1.3 List of sample names per range
Range 1
z = []
value_1 = []
file_number1 = []

for y in T1:

    value = XP_Ramp_df_I.loc[XP_Ramp_df_I.index == date, y].values[0]
    if pd.notnull(value):

        value_1 = re.findall(r"[-+]?\d*\.\d+|\d+", value)

        for items in value_1:

            to_plot = str('{}_{}_{}'.format(spl, date, items))
            z.append({

            'Name' : str(to_plot),
            'Temp' : y,
            'Date': date,

            })

            file_number1.append(int(items))

dat1= pd.DataFrame(z)
R1_df = dat1.set_index('Name')
z
[{'Name': 'ASW_2021_05_24_1', 'Temp': '20K ', 'Date': '2021_05_24'},
 {'Name': 'ASW_2021_05_24_2', 'Temp': '20K ', 'Date': '2021_05_24'},
 {'Name': 'ASW_2021_05_24_3', 'Temp': '20K ', 'Date': '2021_05_24'},
 {'Name': 'ASW_2021_05_24_4', 'Temp': '70K', 'Date': '2021_05_24'},
 {'Name': 'ASW_2021_05_24_5', 'Temp': '70K', 'Date': '2021_05_24'},
 {'Name': 'ASW_2021_05_24_6', 'Temp': '70K', 'Date': '2021_05_24'},
 {'Name': 'ASW_2021_05_24_7', 'Temp': '70K', 'Date': '2021_05_24'}]
R1_df
| Temp | Date | |
|---|---|---|
| Name | ||
| ASW_2021_05_24_1 | 20K | 2021_05_24 |
| ASW_2021_05_24_2 | 20K | 2021_05_24 |
| ASW_2021_05_24_3 | 20K | 2021_05_24 |
| ASW_2021_05_24_4 | 70K | 2021_05_24 |
| ASW_2021_05_24_5 | 70K | 2021_05_24 |
| ASW_2021_05_24_6 | 70K | 2021_05_24 |
| ASW_2021_05_24_7 | 70K | 2021_05_24 |
Range 2
z = []
value_1 = []
file_number2 = []

for y in T2:

    value = XP_Ramp_df_I.loc[XP_Ramp_df_I.index == date, y].values[0]
    if pd.notnull(value):

        value_1 = re.findall(r"[-+]?\d*\.\d+|\d+", value)

        for items in value_1:

            to_plot = str('{}_{}_{}'.format(spl, date, items))
            z.append({

            'Name' : str(to_plot),
            'Temp' : y,
            'Date': date,

            })

            file_number2.append(int(items))

dat2= pd.DataFrame(z)
R2_df = dat2.set_index('Name')
---------------------------------------------------------------------------
KeyError                                  Traceback (most recent call last)
<ipython-input-21-5bf50306e56a> in <module>
     24
     25 dat2= pd.DataFrame(z)
---> 26 R2_df = dat2.set_index('Name')

~\Anaconda3\lib\site-packages\pandas\core\frame.py in set_index(self, keys, drop, append, inplace, verify_integrity)
   4301
   4302         if missing:
-> 4303             raise KeyError(f"None of {missing} are in the columns")
   4304
   4305         if inplace:

KeyError: "None of ['Name'] are in the columns"
R2_df
Range 3
z = []
value_1 = []
file_number3 = []

for y in T3:

    value = XP_Ramp_df_I.loc[XP_Ramp_df_I.index == date, y].values[0]
    if pd.notnull(value):

        value_1 = re.findall(r"[-+]?\d*\.\d+|\d+", value)

        for items in value_1:

            to_plot = str('{}_{}_{}'.format(spl, date, items))
            z.append({

            'Name' : str(to_plot),
            'Temp' : y,
            'Date': date,

            })

            file_number3.append(int(items))

dat3= pd.DataFrame(z)
R3_df = dat3.set_index('Name')
R3_df
| Temp | Date | |
|---|---|---|
| Name | ||
| ASW_2021_05_24_8 | 135K | 2021_05_24 |
| ASW_2021_05_24_9 | 135K | 2021_05_24 |
| ASW_2021_05_24_10 | 135K | 2021_05_24 |
| ASW_2021_05_24_11 | 135K | 2021_05_24 |
| ASW_2021_05_24_12 | 135K | 2021_05_24 |
| ... | ... | ... |
| ASW_2021_05_24_414 | 140K | 2021_05_24 |
| ASW_2021_05_24_415 | 140K | 2021_05_24 |
| ASW_2021_05_24_416 | 140K | 2021_05_24 |
| ASW_2021_05_24_417 | 140K | 2021_05_24 |
| ASW_2021_05_24_418 | 140K | 2021_05_24 |
411 rows × 2 columns
Range 4
z = []
value_1 = []
file_number4 = []

for y in T4:

    value = XP_Ramp_df_I.loc[XP_Ramp_df_I.index == date, y].values[0]
    if pd.notnull(value):

        value_1 = re.findall(r"[-+]?\d*\.\d+|\d+", value)

        for items in value_1:

            to_plot = str('{}_{}_{}'.format(spl, date, items))
            z.append({

            'Name' : str(to_plot),
            'Temp' : y,
            'Date': date,

            })

            file_number4.append(int(items))

dat4= pd.DataFrame(z)
R4_df = dat4.set_index('Name')
R4_df
| Temp | Date | |
|---|---|---|
| Name | ||
| ASW_2021_05_24_393 | 140K | 2021_05_24 |
| ASW_2021_05_24_394 | 140K | 2021_05_24 |
| ASW_2021_05_24_395 | 140K | 2021_05_24 |
| ASW_2021_05_24_396 | 140K | 2021_05_24 |
| ASW_2021_05_24_397 | 140K | 2021_05_24 |
| ... | ... | ... |
| ASW_2021_05_24_495 | 145K | 2021_05_24 |
| ASW_2021_05_24_496 | 145K | 2021_05_24 |
| ASW_2021_05_24_497 | 145K | 2021_05_24 |
| ASW_2021_05_24_498 | 145K | 2021_05_24 |
| ASW_2021_05_24_499 | 145K | 2021_05_24 |
107 rows × 2 columns
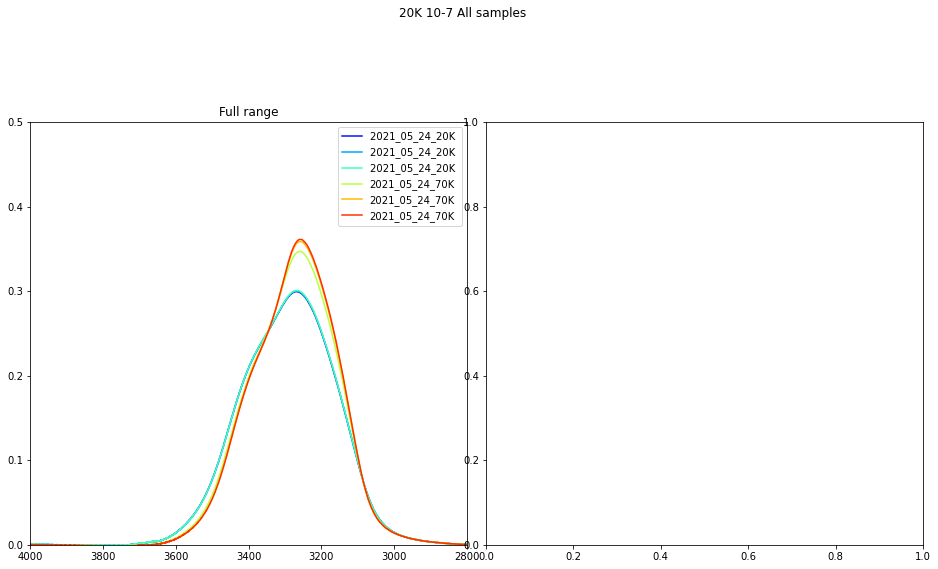
1.4 Plotting
Plot 4 subplot in square formating for all 4 T range
1.4.1 T ranges
Gridspec
gs = gridspec.GridSpec(16, 16,hspace=0.8,wspace=0.5)

fig = plt.figure(figsize=(16,16))

fig.suptitle('20K 10-7 All samples')

ax1 = fig.add_subplot(gs[0:8, 0:8]) # row 0, col 0

nscan = len(list(R1_df['Date'].values.tolist()))


j = 1
for i, j in zip(dat1['Name'], range(1,nscan)):
#    for iscan in range(1,nscan):
#DR2

    #x = DR2_Allscans_full.Wavenumber
    #y = DR2_Allscans_full['{}'.format(i)]

    x = DR3_Allscan_df.Wavenumber
    y = DR3_Allscan_df['{}'.format(i)]

    plt.plot(x,y, label="{}_{}".format(str(R1_df.loc[i]['Date']), str(R1_df.loc[i]['Temp'])), c=cm.jet(j/nscan))

    j=+1
ax1.set_title('Full range')
ax1.axis([4000, 2800, 0, 0.5])

plt.legend()

ax2 = fig.add_subplot(gs[0:8, 8:16]) # row 0, col 0
nscan = len(list(R2_df['Date'].values.tolist()))


j = 1
for i, j in zip(dat2['Name'], range(1,nscan)):
#    for iscan in range(1,nscan):
#DR2

    #x = DR2_Allscans_full.Wavenumber
    #y = DR2_Allscans_full['{}'.format(i)]

    x = DR3_Allscan_df.Wavenumber
    y = DR3_Allscan_df['{}'.format(i)]

    plt.plot(x,y, label="{}_{}".format(str(R2_df.loc[i]['Date']), str(R2_df.loc[i]['Temp'])), c=cm.jet(j/nscan))

    j=+1
ax2.set_title('Normalized zoom')
ax2.margins(2, 2)
ax2.axis([4000, 2800, 0, 0.5])

plt.legend()

ax3 = fig.add_subplot(gs[8:16, 0:8]) # row 0, col 0

nscan = len(list(R3_df['Date'].values.tolist()))


j = 1
for i, j in zip(dat3['Name'], range(1,nscan)):
#    for iscan in range(1,nscan):
#DR2

    #x = DR2_Allscans_full.Wavenumber
    #y = DR2_Allscans_full['{}'.format(i)]

    x = DR3_Allscan_df.Wavenumber
    y = DR3_Allscan_df['{}'.format(i)]

    plt.plot(x,y, label="{}_{}".format(str(R3_df.loc[i]['Date']), str(R3_df.loc[i]['Temp'])), c=cm.jet(j/nscan))

    j=+1

ax3.set_title('BC zoomed')
ax3.axis([4000, 2800, 0, 0.5])

plt.legend()

ax4 = fig.add_subplot(gs[8:16, 8:16]) # row 0, col 0

nscan = len(list(R4_df['Date'].values.tolist()))


j = 1
for i, j in zip(dat4['Name'], range(1,nscan)):
#    for iscan in range(1,nscan):
#DR2

    #x = DR2_Allscans_full.Wavenumber
    #y = DR2_Allscans_full['{}'.format(i)]

    x = DR3_Allscan_df.Wavenumber
    y = DR3_Allscan_df['{}'.format(i)]

    plt.plot(x,y, label="{}_{}".format(str(R4_df.loc[i]['Date']), str(R4_df.loc[i]['Temp'])), c=cm.jet(j/nscan))

    j=+1

ax4.set_title('BC zoomed')
ax4.axis([4000, 2800, 0, 0.5])

plt.legend()

plt.show()
---------------------------------------------------------------------------
NameError                                 Traceback (most recent call last)
<ipython-input-26-d01ae63ef9a4> in <module>
     30
     31 ax2 = fig.add_subplot(gs[0:8, 8:16]) # row 0, col 0
---> 32 nscan = len(list(R2_df['Date'].values.tolist()))
     33
     34

NameError: name 'R2_df' is not defined
insert condition to supress first scan (ramp) Implement maxA Increase spacing between plots
1.6 Scan Averaging and error analysis ?
Supress the first scan and average the remaining scan
Have a though about error bars
1.7 Data processing
1.7.1 Linear regression of desorption
This is where some fitting options needs to be implemented ie:
linear regression for desorption data
Polynomial for isotherms at 130, 135K ?
1.7.2 polynomial fitting of isotherm at 130K
Goal,
\(\color{green}{\text{DP2 : Substraction scan}}\) 
use DR2 data
Purpose here is to obtain 4 different substraction spectra for each of the presestablished range (use hot-warm color to plot)
2.1 Data Sanity Check
DR2_Allscan_df
| Wavenumber | ASW_2021_05_24_1 | ASW_2021_05_24_2 | ASW_2021_05_24_3 | ASW_2021_05_24_4 | ASW_2021_05_24_5 | ASW_2021_05_24_6 | ASW_2021_05_24_7 | ASW_2021_05_24_8 | ASW_2021_05_24_9 | ... | ASW_2021_05_24_483 | ASW_2021_05_24_484 | ASW_2021_05_24_485 | ASW_2021_05_24_486 | ASW_2021_05_24_487 | ASW_2021_05_24_488 | ASW_2021_05_24_489 | ASW_2021_05_24_490 | ASW_2021_05_24_491 | ASW_2021_05_24_492 | |
|---|---|---|---|---|---|---|---|---|---|---|---|---|---|---|---|---|---|---|---|---|---|
| 0 | 799.8442 | 6.517882e-02 | 6.611663e-02 | 6.766044e-02 | 7.767758e-02 | 8.016905e-02 | 8.028784e-02 | 0.079780 | 7.776978e-02 | 7.765637e-02 | ... | 0.048800 | 0.048767 | 0.048408 | 0.049178 | 0.047778 | 0.051763 | 0.052555 | 0.055020 | 0.056034 | 0.061171 |
| 1 | 800.3264 | 6.945459e-02 | 6.969134e-02 | 7.088943e-02 | 7.296595e-02 | 7.390441e-02 | 7.500930e-02 | 0.074624 | 7.745363e-02 | 7.897147e-02 | ... | 0.052965 | 0.053671 | 0.052923 | 0.054063 | 0.053984 | 0.055621 | 0.057292 | 0.059009 | 0.059942 | 0.066201 |
| 2 | 800.8085 | 7.292112e-02 | 7.288691e-02 | 7.361745e-02 | 6.737457e-02 | 6.700571e-02 | 6.841946e-02 | 0.068437 | 7.570509e-02 | 7.891863e-02 | ... | 0.056586 | 0.057301 | 0.056603 | 0.057588 | 0.059036 | 0.058832 | 0.060971 | 0.062315 | 0.063480 | 0.070444 |
| 3 | 801.2906 | 6.940653e-02 | 6.975350e-02 | 7.111548e-02 | 6.573625e-02 | 6.443463e-02 | 6.554944e-02 | 0.066081 | 7.037464e-02 | 7.083752e-02 | ... | 0.051400 | 0.051448 | 0.051381 | 0.052487 | 0.053773 | 0.053324 | 0.055295 | 0.055882 | 0.058406 | 0.063919 |
| 4 | 801.7727 | 6.659455e-02 | 6.678519e-02 | 6.828554e-02 | 6.814425e-02 | 6.737859e-02 | 6.831091e-02 | 0.068845 | 6.914572e-02 | 6.787662e-02 | ... | 0.046206 | 0.046325 | 0.046060 | 0.047885 | 0.049168 | 0.048616 | 0.049703 | 0.050537 | 0.053893 | 0.058902 |
| ... | ... | ... | ... | ... | ... | ... | ... | ... | ... | ... | ... | ... | ... | ... | ... | ... | ... | ... | ... | ... | ... |
| 6636 | 3998.2570 | 6.052594e-04 | 6.155879e-04 | 5.891753e-04 | 4.509248e-04 | 3.057191e-04 | 3.017703e-04 | 0.000373 | 3.303686e-04 | 5.509026e-04 | ... | 0.000525 | 0.000569 | 0.000513 | 0.000519 | 0.000521 | 0.000546 | 0.000569 | 0.000509 | 0.000523 | 0.000514 |
| 6637 | 3998.7390 | 3.875527e-04 | 3.993715e-04 | 3.591537e-04 | 2.900099e-04 | 1.944961e-04 | 1.994642e-04 | 0.000299 | 2.035522e-04 | 3.159683e-04 | ... | 0.000346 | 0.000352 | 0.000322 | 0.000330 | 0.000345 | 0.000352 | 0.000361 | 0.000334 | 0.000336 | 0.000338 |
| 6638 | 3999.2210 | -8.673617e-19 | -4.336809e-19 | -2.168404e-19 | -3.469447e-18 | -1.301043e-18 | 3.469447e-18 | 0.000121 | 2.168404e-18 | 1.734723e-18 | ... | 0.000000 | 0.000000 | 0.000000 | 0.000000 | 0.000000 | 0.000000 | 0.000000 | 0.000000 | 0.000000 | 0.000000 |
| 6639 | 3999.7030 | 7.357823e-04 | 7.429329e-04 | 7.613905e-04 | 3.697233e-04 | 6.489695e-05 | 1.846985e-05 | 0.000126 | 1.990229e-04 | 7.767737e-04 | ... | 0.000430 | 0.000447 | 0.000411 | 0.000422 | 0.000424 | 0.000413 | 0.000430 | 0.000414 | 0.000451 | 0.000435 |
| 6640 | 4000.1850 | 1.665731e-03 | 1.684217e-03 | 1.704210e-03 | 9.846366e-04 | 4.392129e-04 | 3.268367e-04 | 0.000441 | 5.654779e-04 | 1.681778e-03 | ... | 0.001176 | 0.001227 | 0.001154 | 0.001179 | 0.001158 | 0.001152 | 0.001200 | 0.001149 | 0.001240 | 0.001204 |
6641 rows × 493 columns
wavelength = DR2_Allscan_df.T.iloc[0]
wavelength
0        799.8442
1        800.3264
2        800.8085
3        801.2906
4        801.7727
          ...
6636    3998.2570
6637    3998.7390
6638    3999.2210
6639    3999.7030
6640    4000.1850
Name: Wavenumber, Length: 6641, dtype: float64
2.2 Function definition
def substraction(index1, date, index2):

#    exp_date1 = input('date of experiment 1 (format YYYY_MM_DD) = ')
#    index1 = int(input('index 1 = '))
#    exp_date2 = input('date of experiment 2 (format YYYY_MM_DD) = ')
#    index2 = int(input('index 2 = '))

    data1 = DR2_Allscan_df
    #data2 = pd.read_csv('D:\PhD-WS\Projects\PAC\{}}\DATA\{0}\Data\DR2_{}_All_data.csv'.format(XP,date))

    data1 = data1.T.iloc[1:].T
    #data2 = data2.T.iloc[1:].T


#Scan 1

    list_name1 =  list(data1.columns.values.tolist())

    scan_place1 = 0

    for i in range(len(list_name1)):

        name_corr = list_name1[i].split('_')

        if int(name_corr[-1]) == int(index1):

            scan_place1 = i

    scan1 = data1.T.iloc[scan_place1]

#Scan 2

    list_name2 =  list(data1.columns.values.tolist())

    scan_place2 = 0

    for i in range(len(list_name2)):

        name_corr = list_name2[i].split('_')

        if int(name_corr[-1]) == int(index2):

            scan_place2 = i

    scan2 = data1.T.iloc[scan_place2]

    sub_scan = numpy.zeros(len(scan1))

    for iscan in range(len(sub_scan)):

        sub_scan[iscan] = scan2[iscan] - scan1[iscan]

    return sub_scan
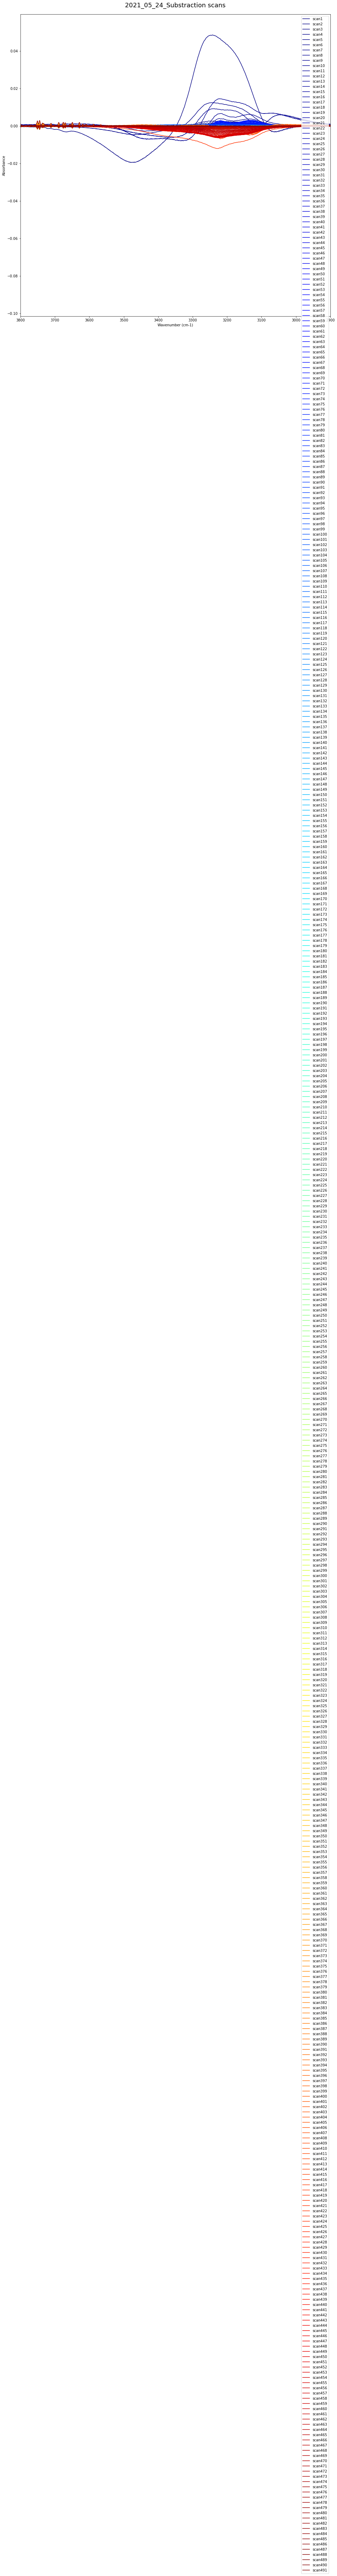
2.3 Plotting
All Range
#date = "2020_09_15"
data1 = DR2_Allscan_df
data1 = data1.T.iloc[1:].T
#data = data.T.iloc[1:].T
#data = data1
nscan = len(list(data1.columns.values.tolist()))
print(nscan)
#print(data1)
fig = plt.figure(figsize=(16,16))
ax = fig.add_subplot()
ax.set_xlabel('Wavenumber (cm-1)')
ax.set_ylabel('Absorbance')
#ax.set_zlabel('Absorbance')
data_sub = []
data_sub_2 =[]
for iscan in range(nscan-1):
iscan = iscan+1
sub_scan = substraction(iscan, date, iscan+1)
df = pd.DataFrame({'Wavenumber': wavelength, "ASW_"+str(date)+"_" + str(iscan) +"-" + str(iscan+1): sub_scan})
#df.to_csv('D:\PhD-WS\Projects\PAC\XP_1-1\DATA\{}\Data\DP1\DP1_{}_sub-scan_{}.csv'.format(date,date, iscan))
#data_int.append(df)
data_sub.append(
{
'Name' : "ASW_"+str(date)+"_" + str(iscan) +"-" + str(iscan+1),
'Wavenumber' : wavelength,
'sub_scan' : sub_scan,
})
data_sub_2.append(df)
plt.plot(wavelength, sub_scan, c=cm.jet(iscan/nscan), label = "scan{0}".format(str(iscan)))
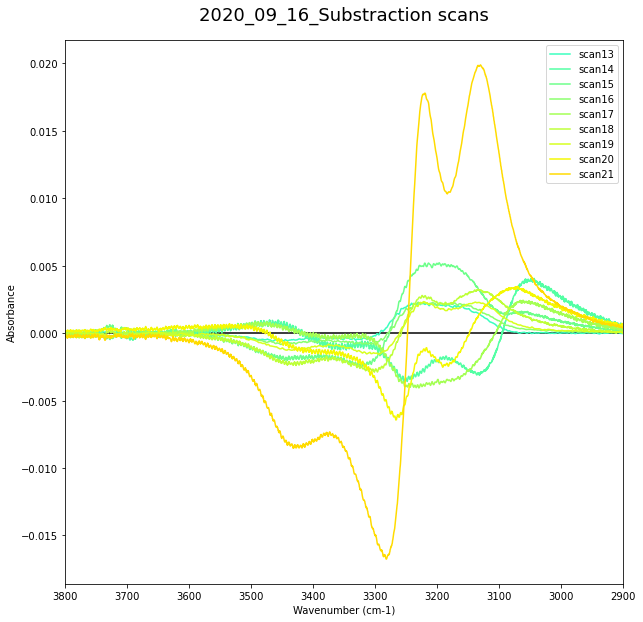
plt.title('{}_Substraction scans'.format(date), pad=20).set_fontsize(18)
ax.hlines(0,3900,2900)
plt.xlim([3800,2900])
plt.legend()
plt.show()
492
C:\Users\vmrd3\Anaconda3\lib\site-packages\IPython\core\pylabtools.py:132: UserWarning: Creating legend with loc="best" can be slow with large amounts of data.
  fig.canvas.print_figure(bytes_io, **kw)
Range 1
Insert condition to use only items present in range 1
#date = "2020_09_15"

data1 = DR2_Allscan_df


data1 = data1.T.iloc[1:].T

#data = data.T.iloc[1:].T
#data = data1


nscan = len(list(data1.columns.values.tolist()))

print(nscan)
#print(data1)


fig = plt.figure(figsize=(10,10))
ax = fig.add_subplot()


ax.set_xlabel('Wavenumber (cm-1)')
ax.set_ylabel('Absorbance')
#ax.set_zlabel('Absorbance')

data_sub = []
data_sub_2 =[]

for iscan in file_number1:

    iscan = iscan+1

    sub_scan = substraction(iscan, date, iscan+1)

    df = pd.DataFrame({'Wavenumber': wavelength, "ASW_"+str(date)+"_" + str(iscan) +"-" + str(iscan+1): sub_scan})

    #df.to_csv('D:\PhD-WS\Projects\PAC\XP_1-1\DATA\{}\Data\DP1\DP1_{}_sub-scan_{}.csv'.format(date,date, iscan))

    #data_int.append(df)


    data_sub.append(

        {


            'Name' : "ASW_"+str(date)+"_" + str(iscan) +"-" + str(iscan+1),
            'Wavenumber' : wavelength,
            'sub_scan' : sub_scan,

        })

    data_sub_2.append(df)


    plt.plot(wavelength, sub_scan, c=cm.jet(iscan/nscan), label = "scan{0}".format(str(iscan)))


plt.title('{}_Substraction scans'.format(date), pad=20).set_fontsize(18)
ax.hlines(0,3900,2900)
plt.xlim([3800,2900])
plt.legend()
plt.show()
492
df
| Wavenumber | ASW_2021_05_24_8-9 | |
|---|---|---|
| 0 | 799.8442 | -1.134107e-04 |
| 1 | 800.3264 | 1.517846e-03 |
| 2 | 800.8085 | 3.213542e-03 |
| 3 | 801.2906 | 4.628880e-04 |
| 4 | 801.7727 | -1.269106e-03 |
| ... | ... | ... |
| 6636 | 3998.2570 | 2.205339e-04 |
| 6637 | 3998.7390 | 1.124161e-04 |
| 6638 | 3999.2210 | -4.336809e-19 |
| 6639 | 3999.7030 | 5.777508e-04 |
| 6640 | 4000.1850 | 1.116301e-03 |
6641 rows × 2 columns
data_sub
[{'Name': 'ASW_2021_05_24_2-3',
  'Wavenumber': 0        799.8442
  1        800.3264
  2        800.8085
  3        801.2906
  4        801.7727
            ...
  6636    3998.2570
  6637    3998.7390
  6638    3999.2210
  6639    3999.7030
  6640    4000.1850
  Name: Wavenumber, Length: 6641, dtype: float64,
  'sub_scan': array([1.54380954e-03, 1.19808933e-03, 7.30539117e-04, ...,
         2.16840434e-19, 1.84575997e-05, 1.99932794e-05])},
 {'Name': 'ASW_2021_05_24_3-4',
  'Wavenumber': 0        799.8442
  1        800.3264
  2        800.8085
  3        801.2906
  4        801.7727
            ...
  6636    3998.2570
  6637    3998.7390
  6638    3999.2210
  6639    3999.7030
  6640    4000.1850
  Name: Wavenumber, Length: 6641, dtype: float64,
  'sub_scan': array([ 1.00171360e-02,  2.07651706e-03, -6.24288189e-03, ...,
         -3.25260652e-18, -3.91667293e-04, -7.19573885e-04])},
 {'Name': 'ASW_2021_05_24_4-5',
  'Wavenumber': 0        799.8442
  1        800.3264
  2        800.8085
  3        801.2906
  4        801.7727
            ...
  6636    3998.2570
  6637    3998.7390
  6638    3999.2210
  6639    3999.7030
  6640    4000.1850
  Name: Wavenumber, Length: 6641, dtype: float64,
  'sub_scan': array([ 2.49147249e-03,  9.38463666e-04, -3.68855160e-04, ...,
          2.16840434e-18, -3.04826309e-04, -5.45423718e-04])},
 {'Name': 'ASW_2021_05_24_5-6',
  'Wavenumber': 0        799.8442
  1        800.3264
  2        800.8085
  3        801.2906
  4        801.7727
            ...
  6636    3998.2570
  6637    3998.7390
  6638    3999.2210
  6639    3999.7030
  6640    4000.1850
  Name: Wavenumber, Length: 6641, dtype: float64,
  'sub_scan': array([ 1.18793290e-04,  1.10489031e-03,  1.41374733e-03, ...,
          4.77048956e-18, -4.64270998e-05, -1.12376200e-04])},
 {'Name': 'ASW_2021_05_24_6-7',
  'Wavenumber': 0        799.8442
  1        800.3264
  2        800.8085
  3        801.2906
  4        801.7727
            ...
  6636    3998.2570
  6637    3998.7390
  6638    3999.2210
  6639    3999.7030
  6640    4000.1850
  Name: Wavenumber, Length: 6641, dtype: float64,
  'sub_scan': array([-5.07472153e-04, -3.85217634e-04,  1.70768859e-05, ...,
          1.20905107e-04,  1.07518578e-04,  1.13815049e-04])},
 {'Name': 'ASW_2021_05_24_7-8',
  'Wavenumber': 0        799.8442
  1        800.3264
  2        800.8085
  3        801.2906
  4        801.7727
            ...
  6636    3998.2570
  6637    3998.7390
  6638    3999.2210
  6639    3999.7030
  6640    4000.1850
  Name: Wavenumber, Length: 6641, dtype: float64,
  'sub_scan': array([-2.01059091e-03,  2.82954489e-03,  7.26855070e-03, ...,
         -1.20905107e-04,  7.30345003e-05,  1.24826107e-04])},
 {'Name': 'ASW_2021_05_24_8-9',
  'Wavenumber': 0        799.8442
  1        800.3264
  2        800.8085
  3        801.2906
  4        801.7727
            ...
  6636    3998.2570
  6637    3998.7390
  6638    3999.2210
  6639    3999.7030
  6640    4000.1850
  Name: Wavenumber, Length: 6641, dtype: float64,
  'sub_scan': array([-1.13410710e-04,  1.51784552e-03,  3.21354176e-03, ...,
         -4.33680869e-19,  5.77750781e-04,  1.11630056e-03])}]
data_sub_2
[      Wavenumber  ASW_2021_05_24_2-3
 0       799.8442        1.543810e-03
 1       800.3264        1.198089e-03
 2       800.8085        7.305391e-04
 3       801.2906        1.361979e-03
 4       801.7727        1.500349e-03
 ...          ...                 ...
 6636   3998.2570       -2.641260e-05
 6637   3998.7390       -4.021780e-05
 6638   3999.2210        2.168404e-19
 6639   3999.7030        1.845760e-05
 6640   4000.1850        1.999328e-05

 [6641 rows x 2 columns],
       Wavenumber  ASW_2021_05_24_3-4
 0       799.8442        1.001714e-02
 1       800.3264        2.076517e-03
 2       800.8085       -6.242882e-03
 3       801.2906       -5.379231e-03
 4       801.7727       -1.412898e-04
 ...          ...                 ...
 6636   3998.2570       -1.382505e-04
 6637   3998.7390       -6.914371e-05
 6638   3999.2210       -3.252607e-18
 6639   3999.7030       -3.916673e-04
 6640   4000.1850       -7.195739e-04

 [6641 rows x 2 columns],
       Wavenumber  ASW_2021_05_24_4-5
 0       799.8442        2.491472e-03
 1       800.3264        9.384637e-04
 2       800.8085       -3.688552e-04
 3       801.2906       -1.301614e-03
 4       801.7727       -7.656528e-04
 ...          ...                 ...
 6636   3998.2570       -1.452057e-04
 6637   3998.7390       -9.551389e-05
 6638   3999.2210        2.168404e-18
 6639   3999.7030       -3.048263e-04
 6640   4000.1850       -5.454237e-04

 [6641 rows x 2 columns],
       Wavenumber  ASW_2021_05_24_5-6
 0       799.8442        1.187933e-04
 1       800.3264        1.104890e-03
 2       800.8085        1.413747e-03
 3       801.2906        1.114804e-03
 4       801.7727        9.323114e-04
 ...          ...                 ...
 6636   3998.2570       -3.948800e-06
 6637   3998.7390        4.968100e-06
 6638   3999.2210        4.770490e-18
 6639   3999.7030       -4.642710e-05
 6640   4000.1850       -1.123762e-04

 [6641 rows x 2 columns],
       Wavenumber  ASW_2021_05_24_6-7
 0       799.8442           -0.000507
 1       800.3264           -0.000385
 2       800.8085            0.000017
 3       801.2906            0.000531
 4       801.7727            0.000534
 ...          ...                 ...
 6636   3998.2570            0.000071
 6637   3998.7390            0.000099
 6638   3999.2210            0.000121
 6639   3999.7030            0.000108
 6640   4000.1850            0.000114

 [6641 rows x 2 columns],
       Wavenumber  ASW_2021_05_24_7-8
 0       799.8442           -0.002011
 1       800.3264            0.002830
 2       800.8085            0.007269
 3       801.2906            0.004294
 4       801.7727            0.000301
 ...          ...                 ...
 6636   3998.2570           -0.000042
 6637   3998.7390           -0.000095
 6638   3999.2210           -0.000121
 6639   3999.7030            0.000073
 6640   4000.1850            0.000125

 [6641 rows x 2 columns],
       Wavenumber  ASW_2021_05_24_8-9
 0       799.8442       -1.134107e-04
 1       800.3264        1.517846e-03
 2       800.8085        3.213542e-03
 3       801.2906        4.628880e-04
 4       801.7727       -1.269106e-03
 ...          ...                 ...
 6636   3998.2570        2.205339e-04
 6637   3998.7390        1.124161e-04
 6638   3999.2210       -4.336809e-19
 6639   3999.7030        5.777508e-04
 6640   4000.1850        1.116301e-03

 [6641 rows x 2 columns]]
Range 2
#date = "2020_09_15"

data1 = DR2_Allscan_df


data1 = data1.T.iloc[1:].T

#data = data.T.iloc[1:].T
#data = data1


nscan = len(list(data1.columns.values.tolist()))

print(nscan)
#print(data1)


fig = plt.figure(figsize=(10,10))
ax = fig.add_subplot()


ax.set_xlabel('Wavenumber (cm-1)')
ax.set_ylabel('Absorbance')
#ax.set_zlabel('Absorbance')

data_sub = []
data_sub_2 =[]

for iscan in file_number2:

    iscan = iscan+1

    sub_scan = substraction(iscan, date, iscan+1)

    df = pd.DataFrame({'Wavenumber': wavelength, "ASW_"+str(date)+"_" + str(iscan) +"-" + str(iscan+1): sub_scan})

    #df.to_csv('D:\PhD-WS\Projects\PAC\XP_1-1\DATA\{}\Data\DP1\DP1_{}_sub-scan_{}.csv'.format(date,date, iscan))

    #data_int.append(df)


    data_sub.append(

        {


            'Name' : "ASW_"+str(date)+"_" + str(iscan) +"-" + str(iscan+1),
            'Wavenumber' : wavelength,
            'sub_scan' : sub_scan,

        })

    data_sub_2.append(df)


    plt.plot(wavelength, sub_scan, c=cm.jet(iscan/nscan), label = "scan{0}".format(str(iscan)))


plt.title('{}_Substraction scans'.format(date), pad=20).set_fontsize(18)
ax.hlines(0,3900,2900)
plt.xlim([3800,2900])
plt.legend()
plt.show()
31
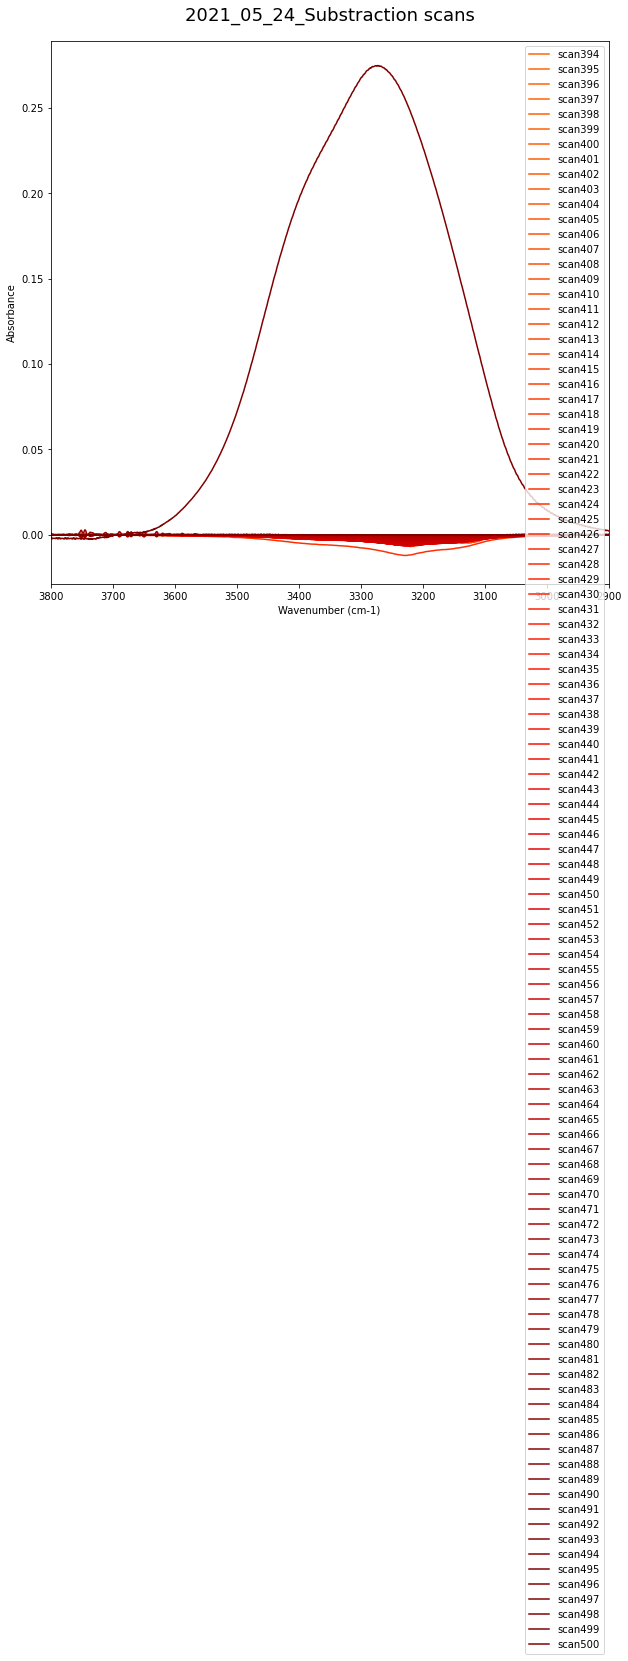
Range 3
#date = "2020_09_15"

data1 = DR2_Allscan_df


data1 = data1.T.iloc[1:].T

#data = data.T.iloc[1:].T
#data = data1


nscan = len(list(data1.columns.values.tolist()))

print(nscan)
#print(data1)


fig = plt.figure(figsize=(10,10))
ax = fig.add_subplot()


ax.set_xlabel('Wavenumber (cm-1)')
ax.set_ylabel('Absorbance')
#ax.set_zlabel('Absorbance')

data_sub = []
data_sub_2 =[]

for iscan in file_number3:

    iscan = iscan+1

    sub_scan = substraction(iscan, date, iscan+1)

    df = pd.DataFrame({'Wavenumber': wavelength, "ASW_"+str(date)+"_" + str(iscan) +"-" + str(iscan+1): sub_scan})

    #df.to_csv('D:\PhD-WS\Projects\PAC\XP_1-1\DATA\{}\Data\DP1\DP1_{}_sub-scan_{}.csv'.format(date,date, iscan))

    #data_int.append(df)


    data_sub.append(

        {


            'Name' : "ASW_"+str(date)+"_" + str(iscan) +"-" + str(iscan+1),
            'Wavenumber' : wavelength,
            'sub_scan' : sub_scan,

        })

    data_sub_2.append(df)


    plt.plot(wavelength, sub_scan, c=cm.jet(iscan/nscan), label = "scan{0}".format(str(iscan)))


plt.title('{}_Substraction scans'.format(date), pad=20).set_fontsize(18)
ax.hlines(0,3900,2900)
plt.xlim([3800,2900])
plt.ylim([-0.0075,0.0075])
#plt.legend()
plt.show()
492
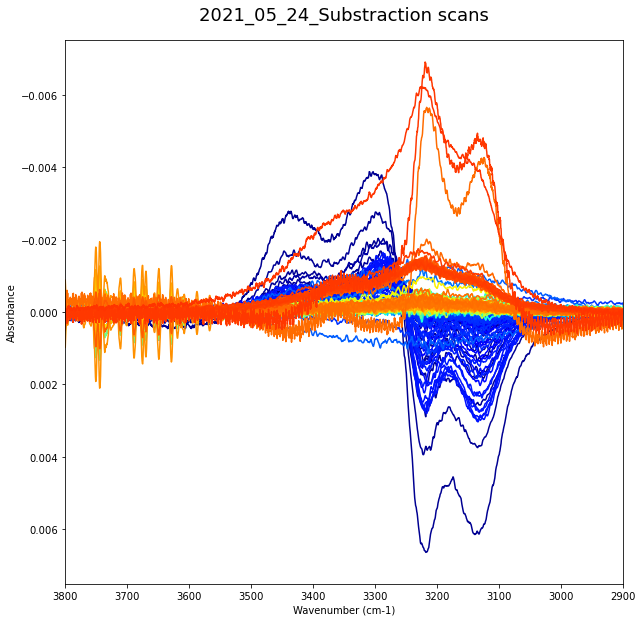
Range 4
#date = "2020_09_15"

data1 = DR2_Allscan_df


data1 = data1.T.iloc[1:].T

#data = data.T.iloc[1:].T
#data = data1


nscan = len(list(data1.columns.values.tolist()))

print(nscan)
#print(data1)


fig = plt.figure(figsize=(10,10))
ax = fig.add_subplot()


ax.set_xlabel('Wavenumber (cm-1)')
ax.set_ylabel('Absorbance')
#ax.set_zlabel('Absorbance')

data_sub = []
data_sub_2 =[]

for iscan in file_number4:

    iscan = iscan+1

    sub_scan = substraction(iscan, date, iscan+1)

    df = pd.DataFrame({'Wavenumber': wavelength, "ASW_"+str(date)+"_" + str(iscan) +"-" + str(iscan+1): sub_scan})

    #df.to_csv('D:\PhD-WS\Projects\PAC\XP_1-1\DATA\{}\Data\DP1\DP1_{}_sub-scan_{}.csv'.format(date,date, iscan))

    #data_int.append(df)


    data_sub.append(

        {


            'Name' : "ASW_"+str(date)+"_" + str(iscan) +"-" + str(iscan+1),
            'Wavenumber' : wavelength,
            'sub_scan' : sub_scan,

        })

    data_sub_2.append(df)


    plt.plot(wavelength, sub_scan, c=cm.jet(iscan/nscan), label = "scan{0}".format(str(iscan)))


plt.title('{}_Substraction scans'.format(date), pad=20).set_fontsize(18)
ax.hlines(0,3900,2900)
plt.xlim([3800,2900])
plt.legend()
plt.show()
492
Preliminary analysis
Purpose here would be (for the different physical processes that the ice undergo upon annealing) to investigate the different contributions lost and gain from the substraction spectra
This will subsequently be used as initial guesses for the gaussian fit of the whole samples
An intermediate gaussian fitting routine could be implemented here with the substraction spectra
Export Data Sub as csv
Concatenation
data_sub
data_sub_2_df = reduce(lambda left,right: pd.merge(left,right, on=['Wavenumber'],how='outer'), data_sub_2)
Export as csv
\(\color{green}{\text{DP3 : Gaussian Fitting}}\) 
Gaussian fit 1
x = DR2_A_df["Wavenumber"]
y = DR2_A_df["ASW_2020_09_16_1"]

pars = exp_mod.guess(y, x=x)

gauss1 = GaussianModel(prefix='g1_')
pars.update(gauss1.make_params())

pars['g1_center'].set(value=3400, min=3300, max=3500)
pars['g1_sigma'].set(value=15, min=3)
pars['g1_amplitude'].set(value=10, min=1)

gauss2 = GaussianModel(prefix='g2_')
pars.update(gauss2.make_params())

pars['g2_center'].set(value=3260, min=3200, max=3300)
pars['g2_sigma'].set(value=15, min=3)
pars['g2_amplitude'].set(value=10, min=1)

mod = gauss1 + gauss2

init = mod.eval(pars, x=x)
out = mod.fit(y, pars, x=x)

print(out.fit_report(min_correl=0.5))

fig, axes = plt.subplots(1, 2, figsize=(12.8, 4.8))
axes[0].plot(x, y, 'b')
axes[0].plot(x, init, 'k--', label='initial fit')
axes[0].plot(x, out.best_fit, 'r-', label='best fit')
axes[0].invert_xaxis()
axes[0].legend(loc='best')

comps = out.eval_components(x=x)
axes[1].plot(x, y, 'b')
axes[1].plot(x, comps['g1_'], 'g--', label='Gaussian component 1')
axes[1].plot(x, comps['g2_'], 'm--', label='Gaussian component 2')
axes[1].invert_xaxis()
axes[1].legend(loc='best')

plt.show()
# <end examples/doc_builtinmodels_nistgauss.py>
---------------------------------------------------------------------------
NameError                                 Traceback (most recent call last)
<ipython-input-42-82c111bdc377> in <module>
----> 1 x = DR2_A_df["Wavenumber"]
      2 y = DR2_A_df["ASW_2020_09_16_1"]
      3
      4 pars = exp_mod.guess(y, x=x)
      5

NameError: name 'DR2_A_df' is not defined