Collision & Growth Mechanism#
Introduction
Intro paragraph
Notes
To Do
Think about coherent plan
Implement
Colaboration
Presentation
Page
Status:

Reviewed: ❌
Updated: 15/02/2023
Introduction#
Science of Collisions#
Note
Insert collision outcome diagram
Sabrina stuffs …
Present the interplay between modelling / Experiments
Review[Dominik, 1997]: Modelling (collisions of dust, ice + other materials), results: growth of aggregates by monomers normally not restructures them, hit-and-stick assumption reasonably valid, significant compaction in aggregate collisions, critical energies for different restructuring processes (help modelling), turbulence compresses aggregates.
Image + science of big body collisions leading to dust cloud
Collision Strength#
Measure of a transfer of momentum in units of energy
Coefficient of restitution ε#
ε is …
[Krijt et al., 2013]: Modelling COR (treat adhesion + viscoelasticity self-consistently, add up energy losses from deformation), viscoelasticity can increase enery dissipation (increasing sticking velocity), collisions above sticking velocity remain dissipative, comparison with lab experiments, model reproduced ε(v) relation observed in experiments (wide range of materials + particle sizes), adhesion + viscoelasticity + deformation are required for realistic model.
Energy Loss#
[Bridges et al., 1996]: Contact sticking experiments (surfaces coated with different types of frost, deposited at various low T and p) results: several frost coated surfaces stick together when brought into contact at ≈ 100 K, sticking force depends on deposition conditions, ice particles covered with H2O/CO2: sticking at low impact velocities, energy loss depends on v and surfaces structure, CH3OH: also effective sticky frost.
Compaction#
[Suyama et al., 2012]: 3D N-body simulations (sequential collisions, aggregates composed of sub-micron-sized icy dust particles, coupling with disk gas, non-equal-mass/equal-mass collisions), insufficient compression -> remain fluffy
Dust aggregates Properties
Geometrical cross section
Volume filling factor
More ? Y
[Yasui and Arakawa, 2009]: Compaction experiments (ice-silica mix, silica volume fractions 0 – 0.29, constant compression speed (0.2 / 2.0 mm/min), 263 K (30 MPa max compaction pressure) or 206 – 218 K (80 MPa max compaction pressure)), results: residual porosity larger for higher silica fractions (0.01 – 0.14 @(263 K & 30 MPa), 2 – 10 times larger @(206 – 218 K & 80 MPa)), model: predicts icy bodies < 700 km diameter to have residual porosity > 0.3 for T < 218 K.
Collision Outcomes#
Explanation
Note
Split image in 3 with the different outcomes:
Sticking
Bouncing
Fragmentation
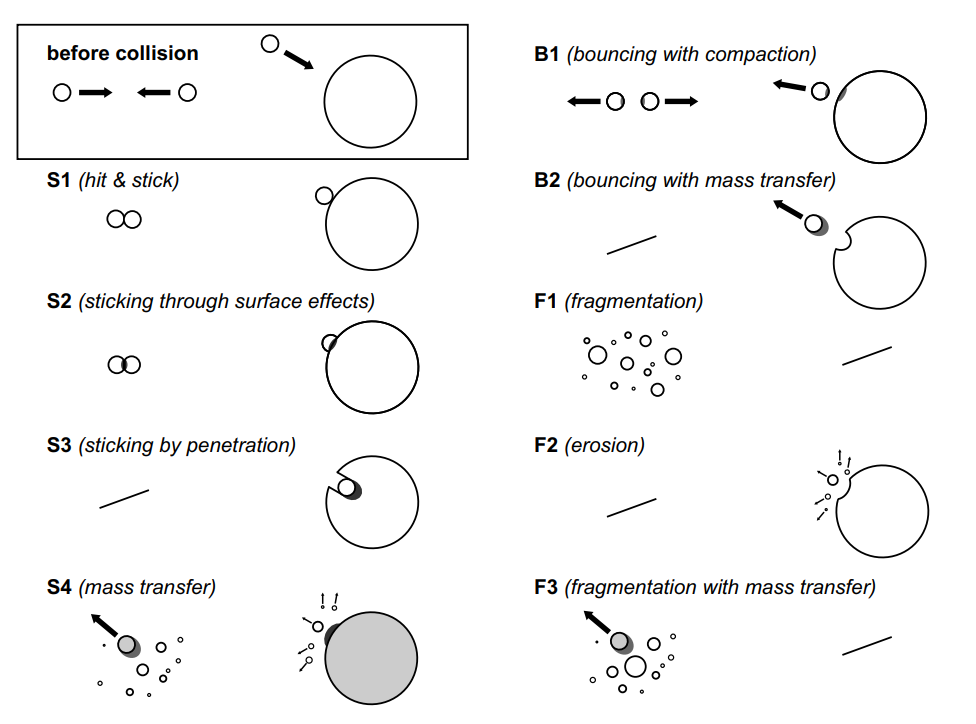
Fig. 46 Caption#
Note
Good review, to read
From Monomer to aggregates#
Theory:
[Chokshi et al., 1993]: silicate, icy, carbonaceous grains, numerical modelling, collision of two smooth/elastic/spherical grains, critical velocity (bouncing barrier) grain size dependent, coagulation too slow for efficient growth, but efficiently removes small grains from cloud.
Review
[Güttler et al., 2012]: Summary of experimental data (COR for various materials), preparation for model paper, digitized data of all summarised experiments provided with the article.
[Perry et al., 2012]: influence of monomer shape (prolate ellipsoidal/spherical) on morphology of dust aggregates, particle-cluster aggregation vs. cluster-cluster aggregation, shape and aggregation mechanism influence compactness (8 – 80 %) and friction times, aggregates of spherical particles may not be good analogues for ISM dust
Note
Use this part to introduce the important theroetical parameters to study collisions
[]: Collision experiments (microgravity (sounding rocket, duration: several minutes), Brownian motion-induced coagulation process of μm-sized dust), result: subsequent collisions form fractal dust aggregates.
[Blum and Wurm, 2000]: Collision experiments (lab & microgravity (drop tower), small dust aggregates (of μm-sized particles) onto solid targets), results: slow impacts in lab: formation of fluffy dust layer (gravity induced compaction in that), fast impacts in microgravity (v > few m/s): disruption of agglomerates, slower impacts in microgravity: sticking and removal from target, slow impacts in microgravity: sticking probability = 1, formation of compact dust layer, slowest impacts in microgravity: no compaction -> growth of very porous dust layer. Computer simulations based on rolling friction force and break-up energy => planet formation: dust aggregates below a few cm in diameter not expected to be subject to impact compaction 75
[Sorace et al., 2009]: Collision experiments (head-on, two identical small particles, acrylic/ceramic/steel, suspended by resilient strands, impact velocity low enough for adhesion), COR lowered by adhesion, apparent adhesion surface energy larger than expected.
[Poppe et al., 2000]: different dust materials (silica, diamond, enstatite, silicon carbide), stickier than theoretically predicted, stickiness depends more on size/shape/roughness than on material
Note
Hence how is the size / shape / surface modified by the collision
-> Next chapter
Modification from collision#
Grain charging#
[Poppe et al., 2000]: Collision experiments on collisional charging (μm-sized grains impacting target surface (non-conducting)), reason: former experiments (particles returning to target after rebound, particle deposition on targets in presence of conducting materials), results: collisional charging stronger than anticipated, needs to be considered (preplanetary dust aggregation, lightning formation in solar nebula, charged grain coupling to magnetic fields).
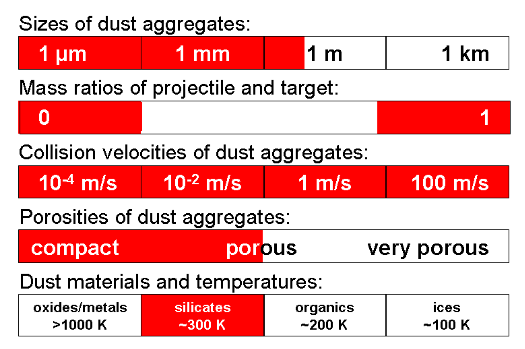
Aggregate collision parameter space#
Explanation
Computation#
Collision Experiments#
Review: [Blum and Wurm, 2008]
Microgravity#
Few momments of “zero G”
Allow for much lower velocity collisions.
Parabolic flights#
[Heißelmann et al., 2011]: Collision experiments (microgravity (parabolic flight), 0.1 – 0.5 m/s, dust / ice), instrument description, results: mostly bouncing, translational energy loss ≈ 95 %.
Sounding Rockets#
[Krause and Blum, 2004]: Collision experiment (microgravity (sounding rocket), Brownian motion-induced collisions), results: dust agglomerates have fractal dimensions as low as 1.4, temporal evolution of mean agglomerate mass described by power law, collision cross section = geometrical cross section, mass-distribution function.
Drop tower experiments#
[Blum et al., 2014]: Collision experiments (description of lab dropt towers for dust (≤ 10 cm, ≤ 70 % porosity) collisions (0.01 m/s ≤ v ≤ 10 m/s)).
Note
Nice explanatory video to extract - Done
Should I put it in a dropdown ?
Dust Collisions#
[Deckers and Teiser, 2014]: Collisions experiments (small drop tower, p < 0.5 mbar, 6.68 m/s, agglomerates of quartz dust (irregularly shaped μm-sized grains), cm-sized projectile (volume filling factor 0.466, varying height, diameter, mass), dm-sized target (1.5 kg, 12 cm diameter and height, volume filling factor 0.44)), results: low collision energies: mass transfer to target, projectile destroyed, accretion efficiency decreasing with increasing obliquity and increasing difference in filling factor (projectile more compact than target), accretion efficiency increases with increasing collision energy until threshold (298 mJ), beyond threshold: catastrophic disruption of target -> critical fragmentation strength: 190 mJ/kg (larger than expected), mass distribution of fragments: more small fragments for higher collision energies, implication for planet formation: smaller particles couple better to gas-drag -> re-accretion more likely.
[Ormel et al., 2007]: Modelling (coupling between dust and gas depends on porosity, aim: quantify influence in turbulent disk, three regimes: hit-and-stick, compaction, fragmentation), results: three stages (initially growth driven by Brownian motion -> high porosity, then turbulent higher velocities -> compaction, then settling out to the mid-plane, aggregates can grow to (porous) sizes of ≈ 10 cm in a few thousand years, before raining out to mid-plane.
[Reissaus et al., 2006]: Collision experiments (Al2O3 (5 – 50 nm) & C (10 – 20 nm) particles produced by laser ablation, impacting on target (C, Au, grease), 10-5 mbar, 1 km/s, sticking efficiency measured by microbalance), result: moderate to high sticking probabilities -> capture and retrieval of atmospheric particles feasible.
High speed#
[]: dust (mm-size to cm-size target), v ≤ 25 m/s, net growth at high speed collisions, fast ejecta 500 m, 40 % of impact velocity) 72
Dust agglomerates#
Review
[Blum, 2006]: Review (physical interactions that lead to sticking in gaseous environments, morphologies of resulting dust aggregates, modelling (temporal evolution + mass distribution of aggregates))
Simulations
[Wada et al., 2007]: Numerical simulations (dust aggregate collisions, 2D head-on), compression & disruption, degree of maximum compression determined by ratio of rolling energy to breaking energy, ice aggregates become more compact than quartz aggregates (same impact conditions), aggregates harder to disrupt with increasing number of particles.
[Wada et al., 2008]: Numerical simulations (dust aggregate collisions, 3D head-on).
[Schräpler et al., 2012]: Microgravity collision experiments (macroscopically homogeneous dust agglomerates of μm-sized silica particles, volume filling factors: 0.3 & 0.4, size: 5 cm, impact velocities: 0.01 – 0.5 m/s), COR + fragmentation velocity measured, ε(v): low v – ε decreases with increasing v, then constant, then onset of fragmentation, interpretation: transition from solid-body-dominated to granular-medium-dominated behaviour, molecular dynamics simulation to model experimental results, extension of earlier work (improved measurements, better statistics, theoretical approach), applications: protoplanetary disks, debris disks, planetary rings.
[Schräpler and Blum, 2011]: Collision experiments (erosion of macroscopic dust agglomerates (μm-sized silica spheres) via impact of μm-sized particles), initial phase (impact erodes up to 10 particles), then compression by impacts (partial passivation of agglomerate) => no erosion for v <̰ 30 m/s, erosion reduced by 1 order of magnitude for v >̰ 30 m/s, confirmed by numerical model, built analytical disk model => erosion is strong source of μm-sized particles in pp disk, explains observations (Furlan et.al)
Note
Check furlan et al
[Seizinger et al., 2012]: Modelling (molecular dynamics approach to include normal forces, rolling, twisting and sliding between dust grains), aim: improve model for interaction of individual monomers to determine threshold between growth and destruction
[Weidling et al., 2012]: sticking threshold velocity of mm dust aggregates could not be reached in the lab so far -> microgravity experiments (> 0.1 cm/s, 0.5 – 2 mm), sticking for few collisions (0.2 – 3 cm/s) -> no sharp bouncing barrier, dust collision model -> deduced velocity below dust will always stick (8 x 10⁻⁵ m/s for mm dust).
[Beitz et al., 2011]: lab dust (cm – decimeter size) collisions, setup 1 - microgravity (8x10⁻³ – 2 m/s), setup 2 - mass transfer (fragmentation velocity 20 cm/s), critical energy for disruptive collisions Q* two orders of magnitude lower than in literature, accretion efficiency (few %) depends on impact velocity & porosity
Note
Using video setup above (group together)
[Kothe et al., 2010]: Collision experiments on mass transfer in shattering collisions (lab + drop tower, agglomerates of μm-sized silica spheres as projectile + target (volume filling factors: 0.15 & 0.45 respectively), velocities 1.5 – 6 m/s), result: linear increase of accretion efficiency with impact v (12 – 21 % of projectile mass), growth of conical structure on target after < 100 impacts (volume filling factor: 0.15 – 0.4, increasing with increasing impact v).
[Blum and Munch, 1993]: Collision experiments (vacuum, 2 mm-sized dust aggregates (ZrSiO4 ≤ 1 μm, 74 % porosity / SiO2 ≈ 12 nm, 97 % porosity), 0.15 – 4 m/s, central to grazing collisions, mass ratios of collision partners 1:1 & 1:66), results: no coagulation (sticking), low v: bouncing, high v: transition to fragmentation (1:1 experiment: transition @ v ≈ 1m/s (ZrSiO4), @ ≈ 4 m/s (SiO2) / 1:66 experiment: transition unclear), fragmentation of 1:1 ZrSiO4: abundance of small fragments increases with increasing v and decreasing impact parameter, power law mass distribution of fragments -> fragmentation model (constant free surface energy per unit surface area of fragments, impact parameter-dependent efficiency for transition of kinetic collision energy into free surface energy of fragments) -> predicts complete disintegration of the ZrSiO4 aggregates for v ≥ 50 m/s, prediction based on van der Waals-bonded constituents: ≈ 3 m/s, typical velocities for the preplanetary nebula -> catastrophic fragmentations could be frequent if aggregates formed by weak surface forces.
Centimeter size#
[Teiser and Wurm, 2009]: lab dust collisions, up to 56.5 m/s, cm – decimetre size targets, sub-mm – cm size projectiles, varying shape, projectiles > 1 mm -> slight erosion of target, decimetre targets don’t break up, small ejecta produced, projectiles < 1 mm accrete (even at high velocities.
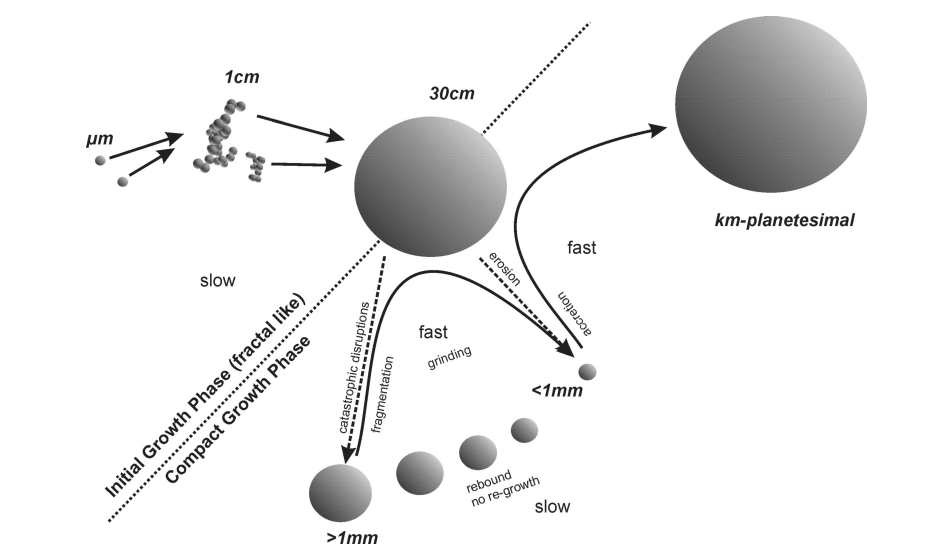
Fig. 47 A model for planetesimal formation. Ejecta in fast collisions only get smaller and do not grow again in mutual collisions. Eventually ejecta get small enough to be (re)accreted by a large object.#
Decimeter size#
[Teiser and Wurm, 2009]: collision experiments, SiO2 (m) aggregates (sub-mm) with dust targets, 7.7 m/s (expected for decimetre size bodies in protoplanetary disks), part of projectile sticks directly, small parts aggregate later by gravity, crust growing (several cm thick), initially very porous (31 % filing), compacting in consecutive collisions, average COR 0.29.
Multiple Collisions#
[Weidling et al., 2009]: Collision experiments (highly porous (volume filling factor 0.15) dust aggregates (of spherical 1.5 μm grains) with solid plate, 0.2 m/s, multiple (≤ 2600) collisions with same aggregate), results: volume filling factor increased by a factor of > 2, fragmentation in few cases (not expected, as threshold is usually higher v).
Chondrules#
[Beitz et al., 2012]: microgravity collisions of dust, chondrules, chondrules with dust, dust coated chondrules (2 – 3 mm, 0.18 – 0.58 chondrule volume filling), few cm/s sticking velocity for dust coated chondrules, collisions with material mix (dust coated chondrule or chondrules colliding with dust) stickier than single materials, chondrules might act as catalyser for planetesimal growth.
Ice Particles Collisions#
[Deckers and Teiser, 2016] : collision experiments (water ice), cm projectiles on decimetre targets, 15 – 45 m/s, 255.8 K, disruptive sticking (low efficiency), upper threshold depends on projectile size (no mass transfer above that), near snowline evaporation and condensation expected to produce solid ice, free fall collisions (7 m/s, cm ice spheres, fragmentation threshold & COR).
[Zamankhan, 2010]: develop realistic model for ice-structure interaction, analysis of Bridges 1984 ice ball experiments, difficult to predict onset of fragmentation/fracturing, most energy dissipation is result of racturing at contact surface, questions validity of constitutive models (e.g. Brilliantov/Hertzsch).
[Schäfer et al., 2007]: numerical study, collisional outcome of low velocity impacts, equal sized porous agglomerates (too large for lab experiments), growth for head-on collisions seems possible, but very little sticking for most material strengths, rotation for glancing collisions, no significant compaction for low velocity impacts
[Hatzes et al., 1988]: experiments, water ice spheres, disc pendulum, 85 K, 10-5 torr, COR: ε(v)= C exp (−γv), 0.015 – 2 cm/s, COR lowered by 10 – 30 % if surface rough/frosted, frost changes COR from exponential to power-law behaviour, application of results to Saturn’s rings
[Lange and Ahrens, 1987]: Collision experiments (cubic & cylindrical ice targets (20 cm), 81 & 257 K, 100 – 640 m/s), results: crater diameters: 7 – 15 cm (2 – 3 x larger than for basalt at same conditions, 10 – 100 x larger than for crystalline rock), craters increase slightly with increasing target temperature.
[Bridges et al., 1984]: experiment results, COR of icy particles, Voyager spacecraft results, thickness of Saturn’s rings < 150 m, several ringlets (few m – 10 km radial dimension), some unstable to viscous diffusion -> optical depth variations
[]: microgravity experiments, collisions of sub-mm dust agglomerates (from m monomer grains), internal structure studied by X-ray CT before experiments -> no rim compaction -> no preparation artifacts, shallow power-law relation between aggregate mass and bouncing barrier velocity, no sharp transition sticking/bouncing, aggregates-of-aggregates stick at higher velocities than homogeneous agglomerates
[Kouchi et al., 2002]: Experiments (organic covered ice and silicate grains), sticking threshold velocity 5m/s.
Comparisons#
CO2 + H2O#
[Musiolik et al., 2016]: Collision experiments (CO2, H2O, 50 % mixture of both, 80 K, 1 mbar, 90 μm particle size), results: CO2 less sticky than H2O, more like silica, sticking threshold velocity increases with increasing water content.
[Arakawa et al., 2000]: Collision experiments (3-component targets to simulate cometary nucleus/planetary regolith (H2O:CO2: pyrophylite = 1:1:0.74), nonheated/heated by thermal radiation), samples formed layer structure inside, results: cratering pattern strongly depends on sample history, nonheated targets: crates with regular shape, ejected volume ~ impact energy E, depth ~E0.5, thermally stratified samples: large amount of loose sub-crustal material ejected (sometimes leading to small hole and huge cavity underneath (velocity dependent).
CO2#
[Musiolik et al., 2016]: lab experiments CO2 (snowline ≈ 10 AU), 80 K, particles (≈ 100 m and target, 0 – 2.5 m/s, bouncing barrier ≈ 0.04 m/s, fragmentation > 1 m/s, analytical model for COR and fragmentation strength, collisional behaviour resembles dust, one order of magnitude smaller bouncing barrier, collisional growth most likely between H2O and CO2 snowlines.
Impact experiments#
[ichi Kawakami et al., 1983]: Collision experiments (cratering and fragmentation of pure ice targets, cylindrical projectiles (aluminium, poly-carbonate, teflon, pyrophyllite), 110 – 680 m/s), results: craters in ice about 2 times larger than in basalt in the same energy range, depth/diameter ratios (0.1 – 0.3) close to basalt values, specific energy for complete destruction of ice: ≈ 50 J/kg (two orders of magnitude lower than for basalt), very large impact craters (Callisto/Mimas) must have fractured the whole satellite.
Note
Need to make a section for satellite collision ?
Dust + Ice#
[Arakawa and Tomizuka, 2004]: Collision experiments (impact disruption of ice-silicate mixtures, silicate mass ratio 0 – 0.5, porosities: 0 – 37 %, 150 – 670 m/s), results: impact strength decreases with increasing porosity (mixture) / increases with porosity (pure H2O), higher silicate ratios enhanced strength.
[Arakawa et al., 2002]: Collision experiments (pure ice & ice-silica mix, porosity ≤ 55 %, 150 – 670 m/s, 263 K), results: maximum ejecta velocity (normalized by impact velocity) decreases with increasing porosity & is independent of material (mix), impact strength: pure ice: increase with increasing porosity, mixture: decrease with increasing porosity, three types of collisional outcome: mass loss, rubble pile formation, regolith formation (compaction).
[Lange and Ahrens, 1983]: Characterization experiments (strain rate and dynamic tensile strength of ice and ice-silicate mixtures), results: strengths vary between 1.6 – 22 MPa, strength increases with increasing silicate content and with applied strain rate (10-2 – 104 s-1), strength-strain relation similar to other geological materials.
Ice aggregates collisions#
The arrangements of grains in an aggregate can be determined using two methods:
BCCA (ballistic–cluster–cluster–aggregation method)
Warning
citation - Meakin 1991 ?
[Sirono and Ueno, 2017]: Numerical simulation: collisions of sintered icy dust aggregates, including temperature induced growth of sinter necks. Results: sintering strongly affects collisional growth, porous aggregates: critical velocity for growth 20 m/s (non-sintered 50 m/s), compact aggregates: main outcome is bouncing
Sticking properties#
[Supulver et al., 1997]: water frost sticking properties, thin porous frost stickier than thick dense frost, temperature fluctuations increase stickiness, frost bond elastic (like spring), they suggest frost to be in proto-planetary nebulae
Sticking between monomers#
[Heim et al., 1999]: Characterization experiments (adhesion, rolling friction force, silica microspheres, 0.5 – 2.5 μm), result: rolling friction force ≈ 100 x lower than adhesion
Mass dependance#
[Dilley and Crawford, 1996]: collision experiments, ice spheres with ice blocks, ≈ 250 K, collisions become inelastic < 1 cm/s, elasticity decreases with decreasing mass
Relative Mass#
[Wada et al., 2013]: Numerical simulation (collisions of different-sized icy dust aggregates), growth efficiency for nearly head-on collisions increases with size, growth efficiency increases with increasing mass ratio of colliding aggregates, growth possible at several 10 m/s for icy dust.
Size dependance#
[Higa et al., 1998]: size dependence of COR, water ice spheres (1.4 – 36 mm), 1 – 1000 cm/s, 261 K, critical velocity
[Meisner et al., 2013]: lab experiments, self-consistent evolution of dust target under continuous impact of sub-mm dust aggregates (71 m/s) -> mass gain of target, accretion efficiency decreasing with increasing velocity, projectile-mass dependent, target volume filling factor stabilizes at 38 %, large bodies can grow further by sweeping up smaller ones (high efficiency).
Velocity#
[]: Microgravity experiments on granular cooling (vibrated granular medium, inelastic iron beads, 2D geometry, high-speed camera), results: COR (low v: ε increasing with v), time decay of energy in the system (cooling time much shorter than could be explained by constant or decreasing ε), better agreement between experiment and theory requires taking into account either rotational degree of freedom or v-dependence of ε.
Impact angle#
[Teiser et al., 2011]: dust aggregate(from m particles) collisions, small (1-5 mm) on target, 20 m/s, 0° - 45°, supports sweep-up planetesimal formation 64
Surface effects#
Theory:
[Kendall et al., 1987]: Experiments (surface energy of Titania/Silica), measure elastic modulus of sub-μm powder assemblies 77
Note
to investigate:
Elastic modulus: Unit of measurement of an object’s or substance’s resistance to being deformed elastically (i.e., non-permanently) when a stress is applied to it
[Hertzsch, 2002]: numerical model, slow collisions, solid grains, planar motion:
elasticity +
viscosity +
soft surface layers +
adhesion +
friction,
COR components, water ice (cm size), critical velocity (bouncing sets in)
Note
Terminology to explore
More#
Magnetic#
[]: Experiments (high coagulation efficiency of 20 nm-sized iron grains, produced in low-pressure H-atmosphere in magnetic field (100 Gauss) -> permanently magnetized), such grains could have been produced in solar nebula by procession of interstellar grains -> could act as “net” for sweeping up silicates -> aid planetesimal formation.
OU setup#
[Hill et al., 2014]: Collision experiments (microgravity, icy particles (4.7 – 10.8 mm diameter, spherical or irregular fragments), 0.27 – 0.51 m/s, 131 – 160 K) colliding with each other, impact parameters: 0 - 1), results: mostly bouncing, few cases of fragmentation, COR evenly spread between 0.08 – 0.65 (average 0.36), ≥ 58 % translational energy lost, ≤ 17 % translational converted to rotational energy, COR not affected by temperature
[Hill et al., 2014]: Collision experiments (1.5 cm ice spheres (pure / 5 % methanol / 5 % formic acid), 0.01 – 0.19 m/s, 131 – 160 K, 10-5 mbar), results: range of COR values, no correlation to chemical composition / velocity / temperature, surface roughness is dominant factor in explaining range of COR
Collisions Outcomes#
Models#
[Geretshauser et al., 2011]: Modelling (preplanetesimals (inhomogeneous, fluffy, porous, dust aggregates), subsequent collisions), inhomogeneity model based on: density distribution of dust aggregates, typical size of aggregates (cm), smoothed particle hydrodynamics code, porosity model, results: inhomogeneous preplanetesimals more likely destroyed than homogeneous aggregates, size of fragments decreases with increasing inhomogeneity => possible obstacle to collisional growth (active history = weaker aggregate).
Growth#
[Tanaka et al., 2012]: molecular dynamics simulation of particle collisions, dust growth
[Blum, 2010]: review (lab & modelling), collisional sticking alone not enough, streaming and gravitational instability best candidates for planetesimal growth in protoplanetary disk.
Computation#
[Garaud et al., 2013]: modelling, velocity distribution includes deterministic motion (from the vertical settling, radial drift, and azimuthal drift) and stochastic motion (from Brownian motion and turbulence), suggest they can thereby overcome bouncing barrier, grow large planetesimals and keep up significant population of small (m) grains.
Aggregate formation#
[Aumatell and Wurm, 2013]: Experiments (nm ice particles), thermal gradient force microscope (measure pull-off forces/twisting torques), ice aggregates in astrophysical settings more robust against restructuring than originally thought, likely grow as fractal aggregates to larger size before they restructure, retain high porosity.
Note
Good work, to read
Density evolution#
[Suyama et al., 2008]: 3D N-body simulations (sequential collisions of aggregates composed of submicron-sized icy particles), density evolution/restructuring/compression, dust aggregates have extremely low density (<0.1 kg m-3).
Sintering#
[Maeno' and Eblnuma, 1983]: Sintering experiments, six or more mechanisms contributing to neck growth simultaneously, review of pressureless sintering processes (vapour transport dominating, surface diffusion important in early stages), densification of snow = pressure sintering (takes into account three diffusional and dislocation creep mechanisms).
[Hobbs and Mason, 1964]: characterisation experiments (sintering (single and polycrystalline ice spheres (50 – 700 μm diameter), -3 – -20°C ), in air/hydrogen-gas/oil), results: evaporation-condensation theory valid (diffusion through environmental gas enhances neck growth), no evidence of liquid-like surface layer found unless surfaces are contaminated (e.g. by salts).
Note
evaporation-condensation theory: to define
[KUROIWA, 1961]: Characterization experiments (sintering (ice spheres < 200 µm diameter), in saturated air/kerosene environments), results: neck growth rate, ice-bonding (adhesion) is result of solid diffusion
Mass Transfer#
Erosion#
[Seizinger et al., 2013]:model (molecular dynamics, spherical grain interactions, visco-elastic damping force, different sample generation methods), visco-elastic damping crucial to reproduce lab-results, erosion at impact velocities > 5 m/s, compact aggregates harder to erode, increasing projectile size shifts erosion threshold to higher velocities
Effects of collision on Amorphous Ice#
The Bouncing Barrier#
[Kelling et al., 2014]: Long term lab experiments, interaction of 100 dust aggregated with each other (1 mm, mm/s – cm/s, 900 s duration, 105 collisions, 2000 analysed), sticking and fragmentation, no net growth, bouncing barrier is likely limit of self-consistent particle growth.
[Windmark et al., 2012]: model, dust growth, effect of probability distribution on growth barriers (bouncing/fragmentation) -> barriers not sharp, small fraction of particles manage to grow orders of magnitude above the main population, velocity distribution softens fragmentation barrier + removes bouncing barrier, broadens size distribution -> seeds for sweep-up.
[Zsom et al., 2010]: collision model based on lab experiments (dust aggregates), investigation of upper size limits for coagulation in protoplanetary disks, dust is modelled as spheres with porous and compact phases (continuous transition), include Brownian motion/radial drift/turbulence, 1 AU, midplane, different gas densities, catastrophic fragmentation very rare, quasi-steady states in distribution function by bouncing, turbulence has non-linear influence, aerodynamic size sorting of particles.
Note
Online material avalable here
Summary#
Warning
Important to stop at the Bouncing barrier
Planetesimals are for next page
Note
Finish by showing experimental diagram of all collisions