Novel methodology for producing amorphous ice micro-particles - 2nd Version#
Implementing the lessons learned from the proof-of-concept phase, we have built a second-generation experiment to address the previously described challenges. The process remains similar, cooling a Reaction vessel made of copper to liquefied gaseous ethane in which µm sized water droplet will be introduced aiming to produce HGW particles. The previous experiment required a lot of manipulations within the glove box during the cooling phase and we have thus designed this novel setup to minimize interventions from ourselves and thus making it safer and more reliable. Additional safety features include the fitting of a pressure gage to monitor any over-pressurization within the glove box. A proportional relief-valve with a burst pressure of 0.2 bar has also been implemented.
Overall Design#
A new glovebox made of polycarbonate (good resistance to cold temperature), has been bought enabling a bigger volume (Dimensions?) and is presented in Figure 5. Two major improvements have been implemented. First, the reaction vessel (1 in figure 5) is no longer cooled by submersion in liquid Nitrogen but by an open cold N2 gas flow passing through a solenoid copper pipe in contact with the copper Reaction vessel. Liquid Nitrogen is channeled to the Glove box via a PTFE flange (2 in figure 5) from a pressurized Dewar (200L). The temperature is control and adjusted by using a 20W power heating wire attached between the pipe interstices and connected to a PID controller. Secondly, we decided to abandon the membrane “fishing method” and to recover the particles within the liquid ethane, thus reducing the level of manipulation and consequently modification of the particles. Intermediate step for further separation (Link with XP Part II recover particles in acoustic trap and evaporate ethane using low pressure) A cryogenic ball valve (6 in Figure 5) has been installed at the bottom of the reaction vessel for that purpose and different recovery setup can be installed beneath the reaction vessel for various sample handling and storage method, increasing experimental versatility. A recovery nozzle is screwed downstream the valve and can be interchanged
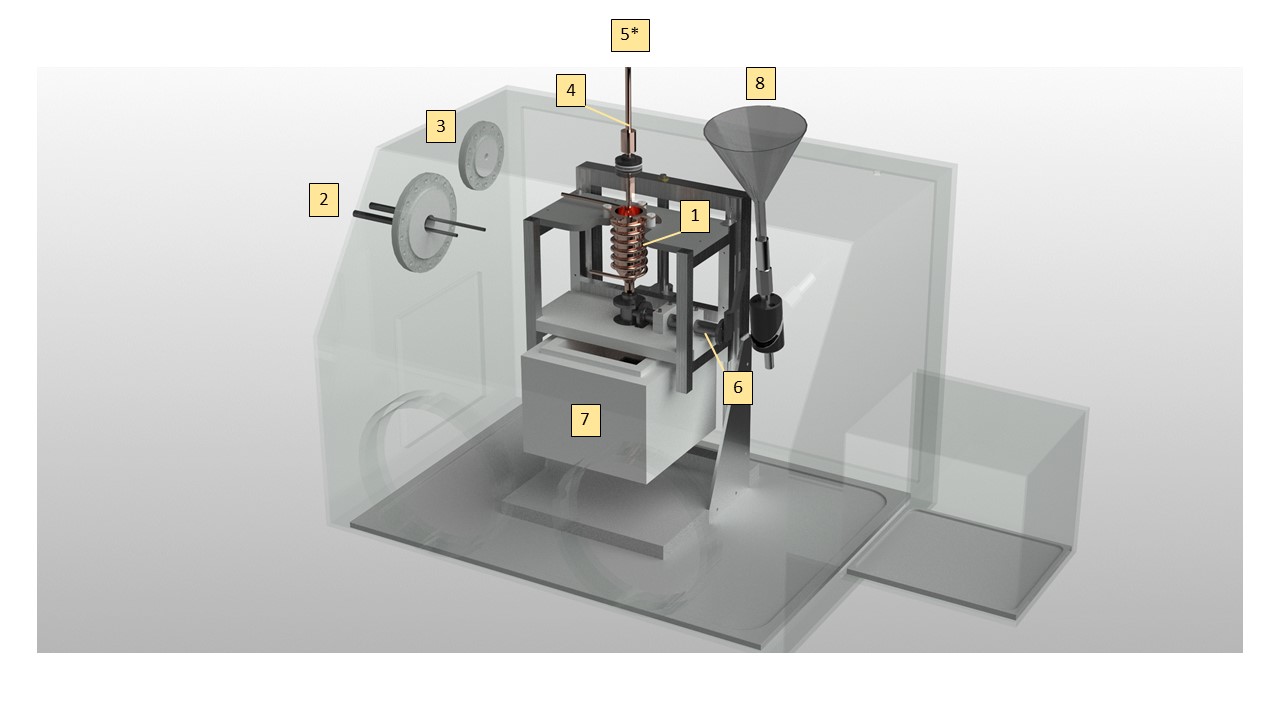
Fig. 6 Glove box setup. numbers will be explained in the text#
Reaction vessel with integrated copper tubing around outer wall. The pipe is silvered soldered to the copper vessel in order to achieve a maximal thermal transfer. Between the pipe interstices is attached by Kapton tape a heating wire (reference) directly connected to a PID controller (Lakeshore model 335). 2 T type thermocouples are attached to the Reaction vessel (cf. Figure 7 for thermocouple setup) in order to precisely control it temperature, allowing for (a) ethane liquification and (b) amorphous ice formation.
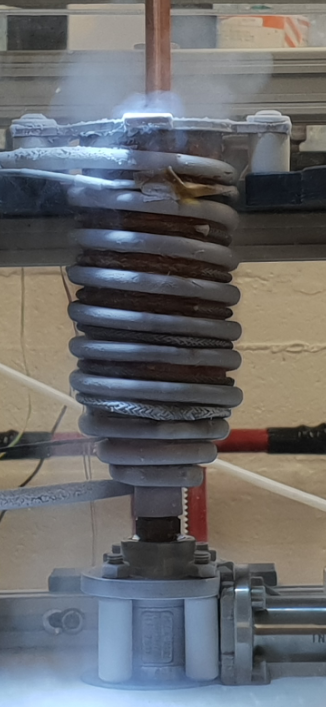
Fig. 7 Reaction vessel#
1 cm thick PTFE Flange featuring liquid Nitrogen feedthrough CF-40 (MDC Vacuum 9812105). Inlet is connected to a pressurized Deware (200L) and connected to Reaction vessel piping by a corrugated hose. Flexible tubing (e in Figure 7) allow the reaction vessel to move up and down by more than 10 cm and to adjust its position with respect to the Nozzle or to the sample recovery area.
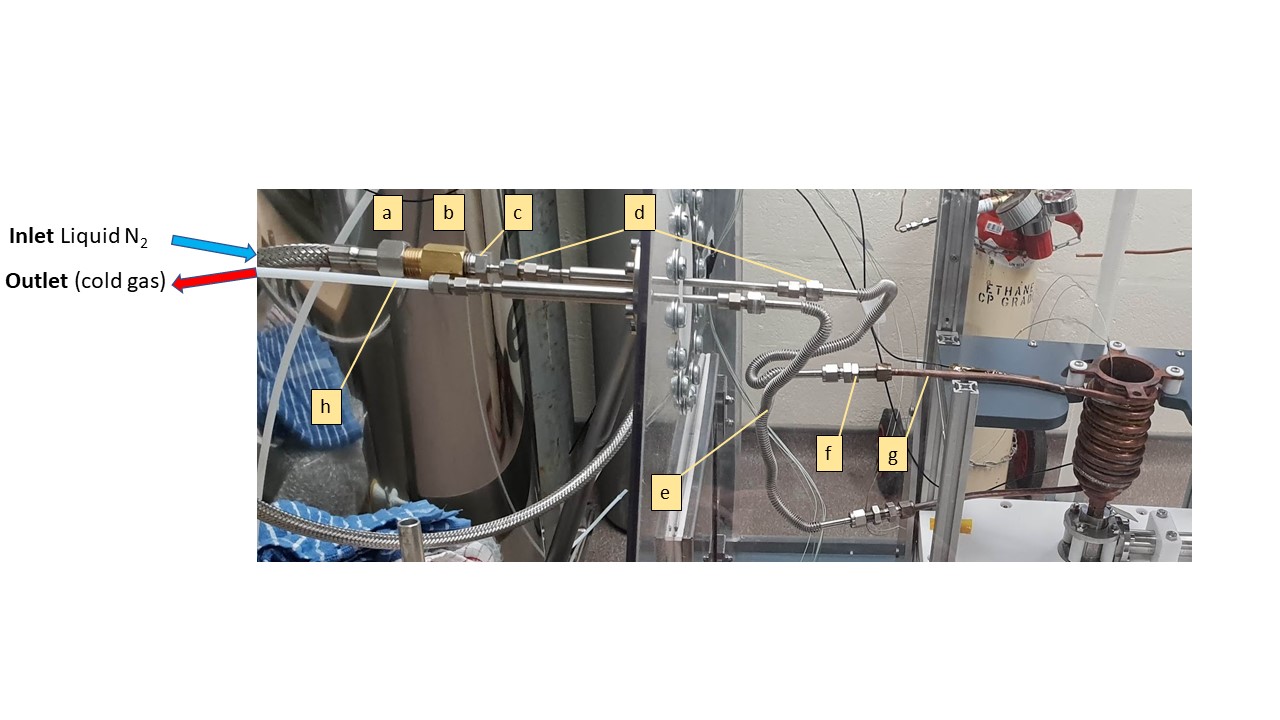
Fig. 8 Liquid N2 PTFE flange setup [a] cryogenic hose ½“ BSP , [b] ½” male to female adapter, [c] Male tube adaptor ¼” tube OD * ½” (Swagelock SS-4-TA-1-8), [d] Swagelock tubing connection ¼” , [e] Stainless steel flexible tubing ¼” OD (Swagelock 321-4-X-12-B2), [f] Bulkhead union ¼” OD (Swagelock SS400-61), [g] Copper tubing ¼” OD, [h] PTFE tubing ¼” OD,#
PTFE Flange for electrical equipment; One Thermocouple feedthrough (6 * T type) and the heating wires (cf. Figure 9).
Nozzle featuring copper block heating ring attached. Prevents water freezing in nebulizer and/or line from water reservoir. Controlled via PID controller and attached thermocouples.
Nebulizer inlet. Reservoir of deionized water and/or D2O connects though this port, pressure is provided by dedicated nitrogen cylinder secured in lab to deliver water into copper vessel [5] as a fine mist through the nebulizer.
Valve attaching to base of reaction vessel. Rated for operation with cryogenic materials/environments.
Release point for material in copper vessel [1] when valve [6] is opened
Funnel port. Valve at base of funnel isolates this port from the inside of the chamber during normal operation. It can be opened to allow addition of liquids, e.g. small amounts of liquid nitrogen to a Deware if/as required. Could also serve as back-up for pressure-relief-valve.
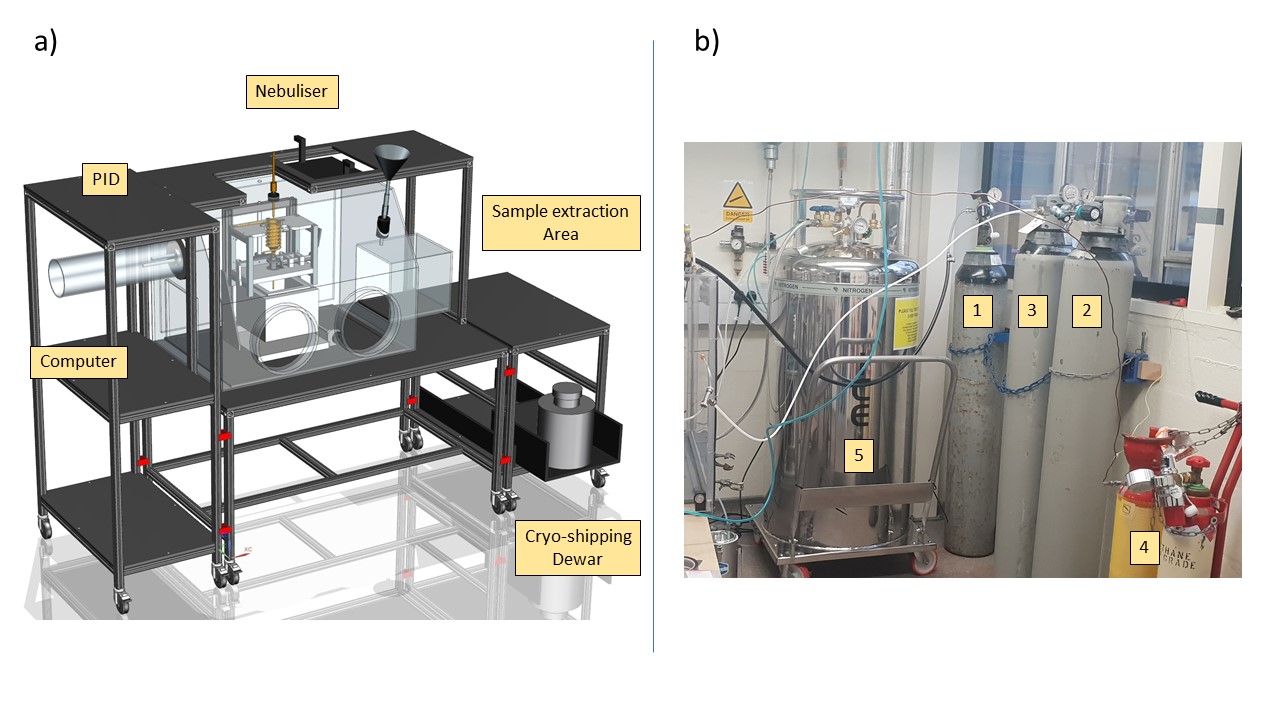
Fig. 9 Overall setup a) BOSH Design b) Gas setup#
XP transportable and self-contained
Designed to minimize time between sample extraction and storage
1 -3 Are Nitrogen gas bottles. 1 is 0 grade and connected to the nebulizer via a custom fitting. 3 is connect via ¼ “piping to both the main and the airlock chamber of the Glove box for purging. The experiment can be long and another full bottle (2) must be present to ensure that the purge will be on at all time. 4 is the ethane bottle. 5 is a pressurized liquid Nitrogen Dewar connected to the cooling circuit via a cryogenic hose. A protection has been put in place to avoid to much condensation on the cold surfaces outside the glove box, but frost is unavoidable.
Targeted Design#
Temperature control and recording#
Cooling#
Liquid nitrogen cool reaction vessel, warm up, transform to gas (expansion ratio 1:694 ) and is extracted through PTFE flange into a Deware (to recover liquid if any). Lot of Nitrogen is released into the atmosphere that need to be well ventilated. The lab needs also to have proper Oxygen alarm. Even with very long experiment, no liquid Nitrogen has been recovered into the Dewar. The flow of Nitrogen passing through the pipe is a parameter difficult to monitor and thus to control. It could have been monitored using a flow meter connected to the exhaust, but this is not feasible as no flow meter are currently rated for use at cryogenic temperature. However, it is possible to obtain a visual information about the flow rate. Despite nitrogen being a transparent gas, when cold enough it can produce a fog due to condensation of ambient water droplets from the lab, like cloud formation in the atmosphere (to be explained much better !!). This phenomenon allows us to get a quantitative information about the Nitrogen flow as depicted by Figure 9.
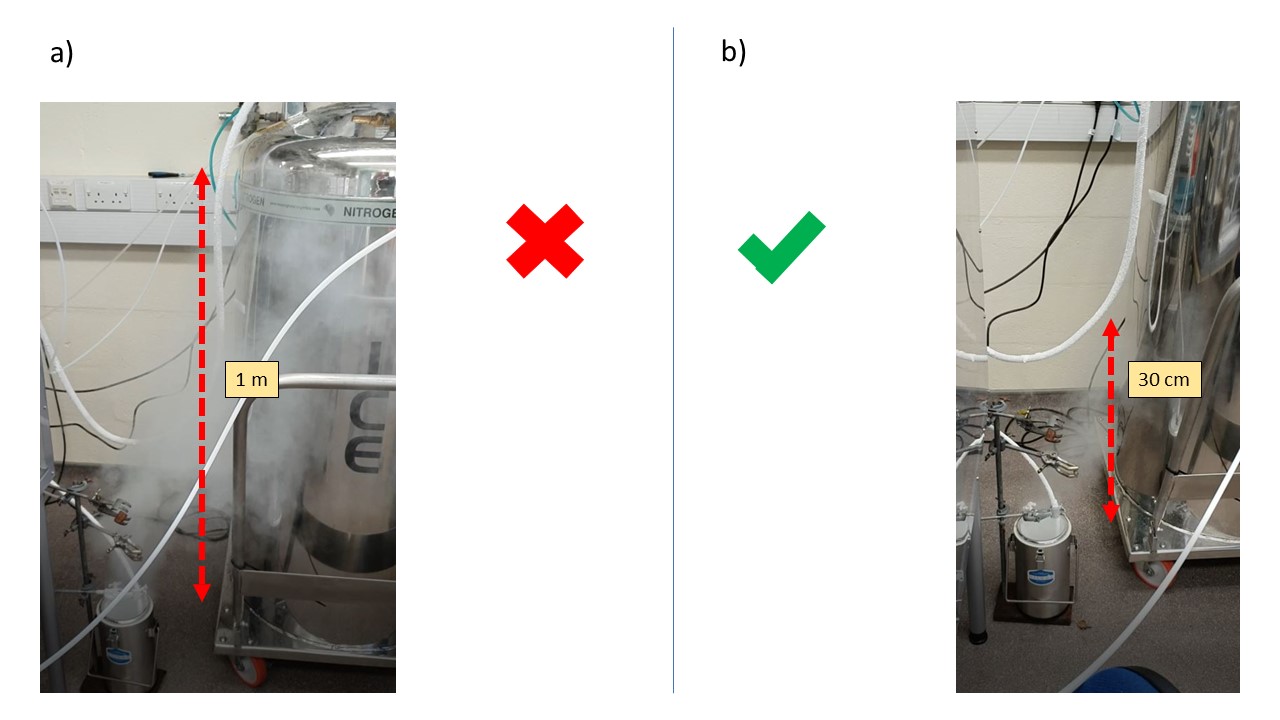
Fig. 10 Liquid Nitrogen exhaust setup.vRed arrow describe … a) Liquid Nitrogen flow too important b) Adequate Liquid Nitrogen flow#
2 parameters are important to control the Nitrogen flow. The base pressure of the cryogenic Dewar and the valve opening percentage (cf Figure 14 b). The cryogenic pressure is usually set up by the fabricant. It can be tuned by modifying the bursting pressure of the pressure relief valve fitted on all those Deware but the pressure take time to build up and is not suitable for fine tuning on the fly as required by the experimental procedure. So I have to use the opening of the valve as the adjustable parameter for the Nitrogen flow variable. Very fine tuning … Not consistent all along the experiment …
Warming up and Temperature control#
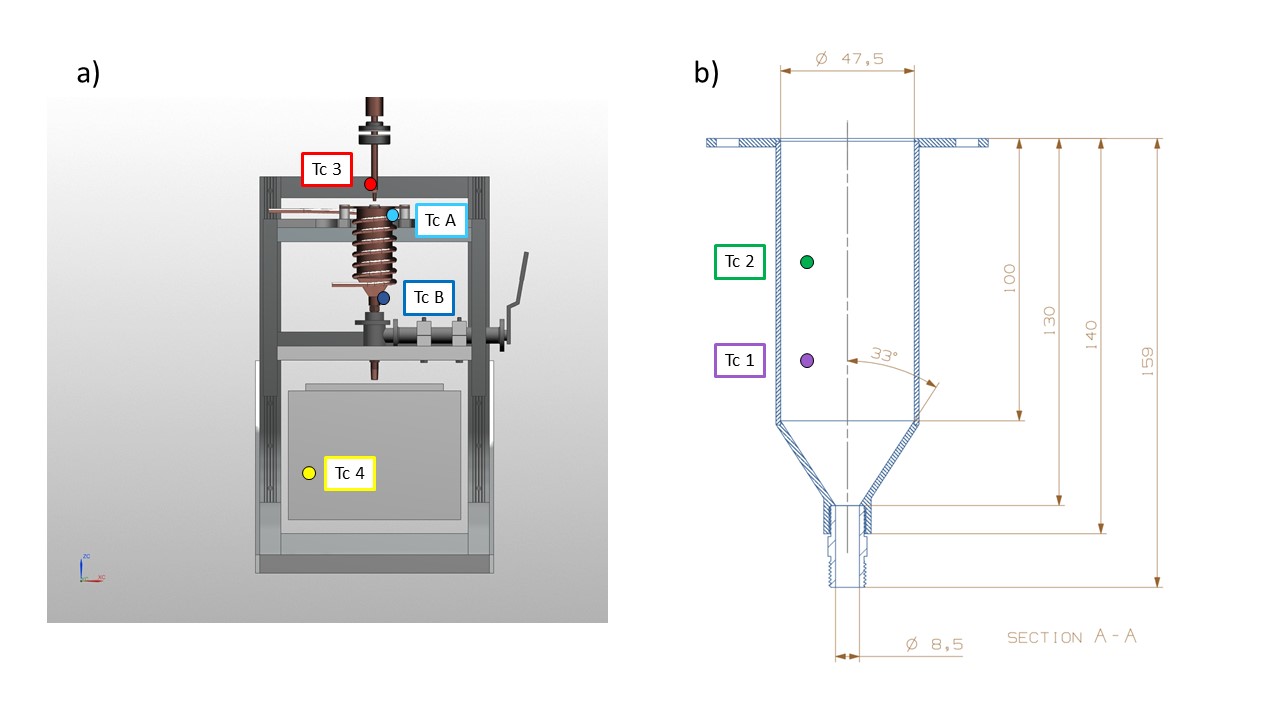
Fig. 11 Thermocouple setup a) outside the reaction vessel, b) inside reaction vessel#
Temperature measurement within the glove box is performed using T type thermocouples (Cu\Cu + Ni), rated for constant use at temperature between -200 to 350 °C. They represent the best thermal sensor for our purpose because cost effective, strong and versatile in usage and because very high precision is not required. The inner (within the glove box) end of the metallic wires has been spot welded to create the measurement junction. 6 thermocouples are channeled through the glove box via the same feedthrough, ATEX certified (Ex II 2 GD, Ex d IIC Gb / Ex e IIC Gb, Ex ta IIIC Da) for use with vacuum and pressurized system but more importantly certified to work under explosive atmospheres. Tc A and Tc B (light and dark blue in Figure 9) are attached with Kapton tape at the top and bottom of the reaction vessel and are connected to a Lakeshore PID (model 335). It is important to have two thermocouples at different places on the reaction vessel to measure the differential cooling efficiency from the liquid nitrogen flowing through the copper pipe A simple Labview code allow the control of TCB temperature by applying a voltage to the heater. (Why TCB – description of Labview code) TC 1,2,3,4 are attached to a Picolog TC-08 and are recorded separately from TCA and TCB. TC1 and TC2 are attached to the frost shield at different depth to measure any temperature gradient variation within the cryogen. TC3 is attached to the nozzle in order to prevent frost formation. TC4 is a flying thermocouple that we can move to monitor the temperature within different area of the glove box. It is used to record different piece of equipment involved in the sample recovery and transfer procedure.
2 different software used to record the temperatures (Labview, to work with Lakeshore TCA and TCB) and Pico log software for TC1, 2, 3, 4. To be described ?
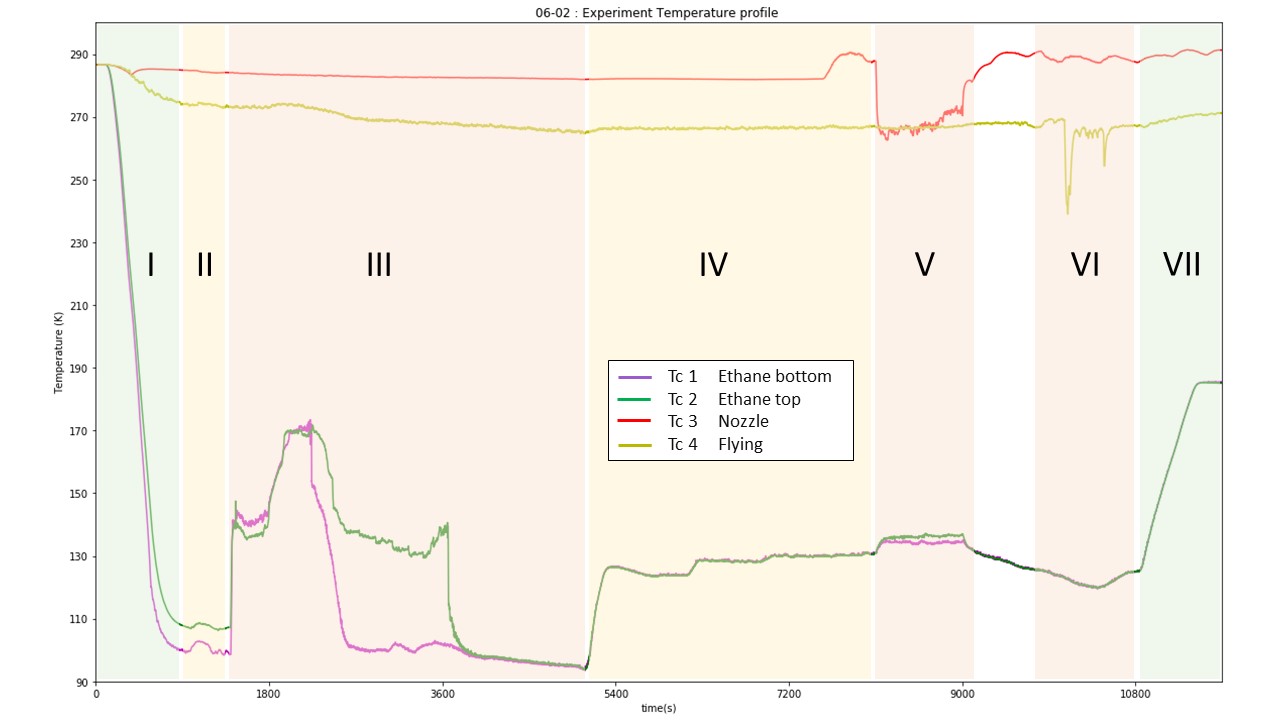
Fig. 12 Experiment temperature profile. The different number refer to each experimental step : I. Reaction vessel cooling; II. lN2 flow reduction; III. Ethane introduction/liquefaction; IV. Temperature setting; V. Water introduction; VI. Sample recovery; VII. Ethane warm up/evaporation. Color refer to the level of manipulation needed for each phase, green: not much to do, red: lot of manipulation needed.#
:::{note} Insert Table to explain the different experiment steps :::
Figure X represent the temperature evolution of TC 1-4 for a typical experiment. The first phase corresponds to the cooling of the Reaction Vessel. 15 minutes are enough to cool the Reaction vessel (Abbreviation) to its base temperature (around 100K). TCA and B are not shown on this diagram for clarity, but a more precise cooling curve is shown in Figure 12. In order to match with the low power of the heater the N2 flow needs to be reduced at the minimum and that is achieved during the second phase. The third step is the ethane liquefaction who is characterized by a steep increase in both inner temperature TC1 and TC2. Consequently, the temperature show a steep decrease when the thermocouple are immerged by the cryogen (TC1 first and then TC2). The phase IV correspond to the time period where the ethane is set up within the desired range prior to the water introduction (V). VI correspond to the sample recovery and VII to the boiling off the ethane and the shut down procedure.
Water droplet production#
Similar but care has been taken to control and minimize pipe length to diminish droplet condensation on the pipe walls. Also, nozzle is straight Distance heater - nozzle end.
Sample recovery method#
Because the sample is recovered from the bottom of the reaction vessel an empty space area has been designed below the reaction vessel (roughly 101010 cm), allowing different sample recovery setup to be put in place. 2 method have so far been developed. One that allow filling in 1 ml cryo-vials with ice sample embedded into the cryogen to be stored in a cryoshipping Dewar (reference). The other method has been developed jointly with ISIS Neutron and muon source in order to fill a Vanadium square cell, necessary to perform Neutron scattering experiment.
Sample storage#
(Picture of sample holder with vials). A metallic sample holder designed to hold the vials is inserted into a polystyrene box. Liquid Nitrogen is filtered and introduced through funnel (8 in Figure 5) into the polystyrene box.
ISIS cell filling#
(diagram + picture of the setup) Vanadium foil + 1 or 2 mm spacer – Copper block – long time to cool – Heat sink Funnel made of spacer hold together by Aluminum tape. Ethane drained through lose junction between cell and funnel. Bucket to recover the remaining ethane.
The cooking recipe to produce HGW µm ice particles#
Warm-up and Glove Box purging#
All material putted in the glove box to ensure a nice and clean working space Check integrity of system, thermocouple attachment … Back panel of glove box screwed in place Nitrogen purge 1h, stopped when the Oxygen level reach a plateau (1%). No explosive atmosphere and most of residual water removed from the glove box use of dessicant, calcium carbonate, not that efficient … but tackled by having “cold spot” away from the reaction vessel cold trap. Capture some of the water molecules but frost remain a big issue.
:::{note} Insert Figure GB purging :::
Reaction vessel cooling#
2 temperature recording software (Labview and Picolog) are started (t = 0) and the valve on the Pressurized Deware is open (2C) 1 minute later.
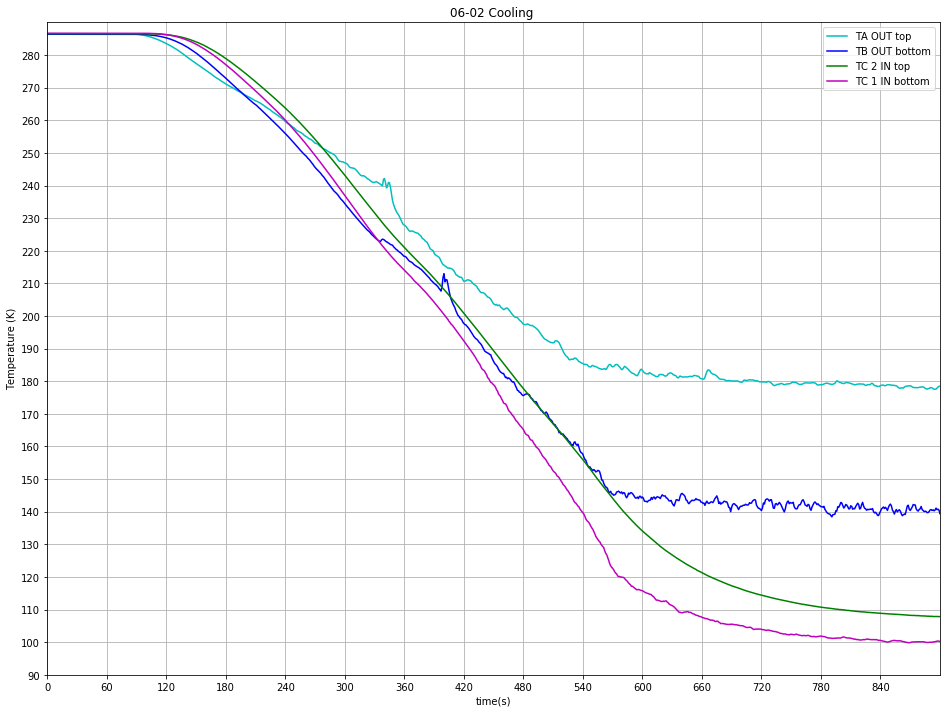
Fig. 13 Typical cooling curve#
As described earlier the valve opening is key to control Nitrogen flow through the pipe. Various experiment with different valve opening percentage have been performed and show that the maximum cooling is achieved at 2C (cf Figure 14 b) and that a further opening doesn’t improve the cooling efficiency.
:::{warning} Cooling curve comparison (could have been good to have a comparison of each TC with increasing valve opening but data unexploitable …) :::
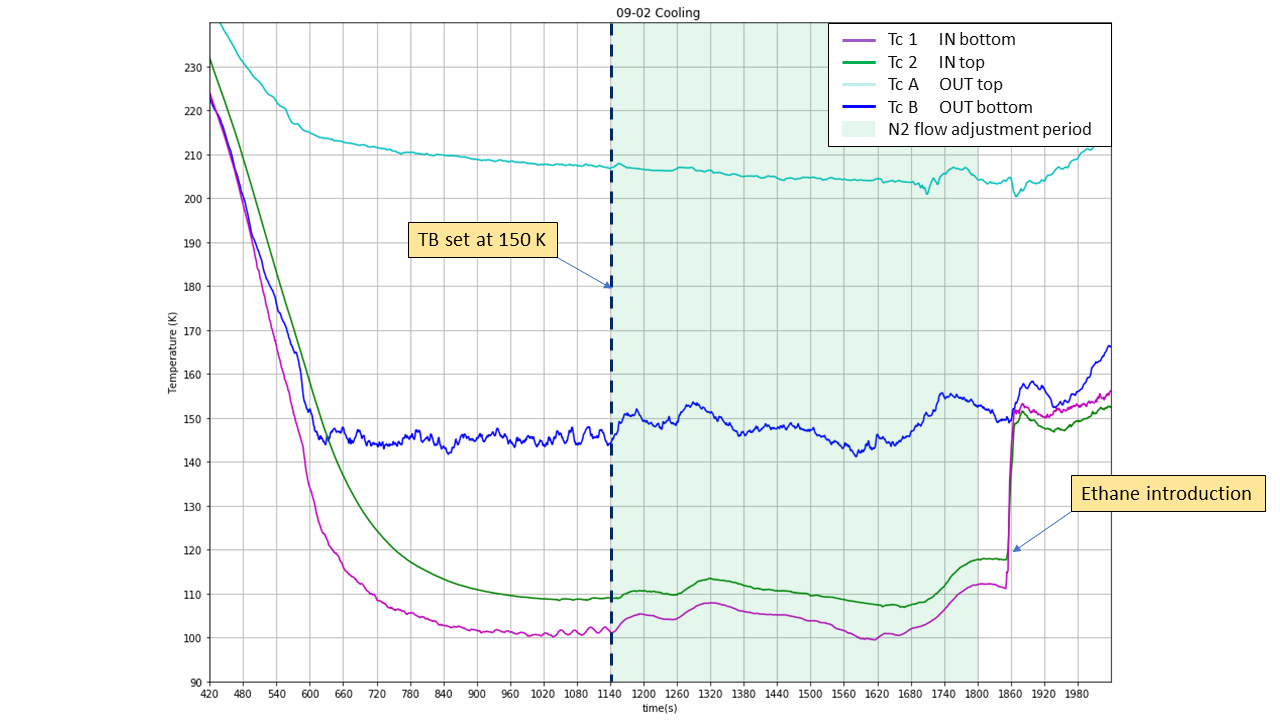
Fig. 14 Flow adjustment period#
After Reaction vessel has reached base temperature The Nitrogen Deep care needs to be taken to control and adjust this parameter all along the experimental procedure as it can randomly vary. A liquid Nitrogen flow set up too high won’t allow the Heater to work properly.
Ethane liquefaction#
Once the Liquid Nitrogen flow has been adjusted correctly (as low as possible), gaseous ethane can be introduced. The ethane pipe inside the glove box (downstream to valve?) must be placed inside the Reaction vessel (cf. Figure 15) whose height can be adjusted to allow an immersion of the pipe around 2 to 3 cm inside the Reaction Vessel. Ethane flow is started by opening first the valve ? on the ethane cylinder and valve ? located on the glove box. This will result in the apparition of a fog (micro particles of solid ethane?) shown in figure 15 a) and b). Ethane flow is monitored by a digital pressure gage located downstream the regulator attached to the ethane gas cylinders. A pressure too important will result in a turbulent fog (Figure 15 a)) resulting in a loss of material. Consequently, to improve the liquefaction efficiency, the ethane flow is progressively reduced to obtain a steady introduction (Figure 15b)). It is usually obtained for a pressure around 80 mbar. This phase is marked by a steep increase in TC1 and 2 temperature, due to the introduction of a hot gas within the reaction vessel. The first 10 minutes of introduction required a lot of attention, time for the system to reach an equilibrium (explain more).
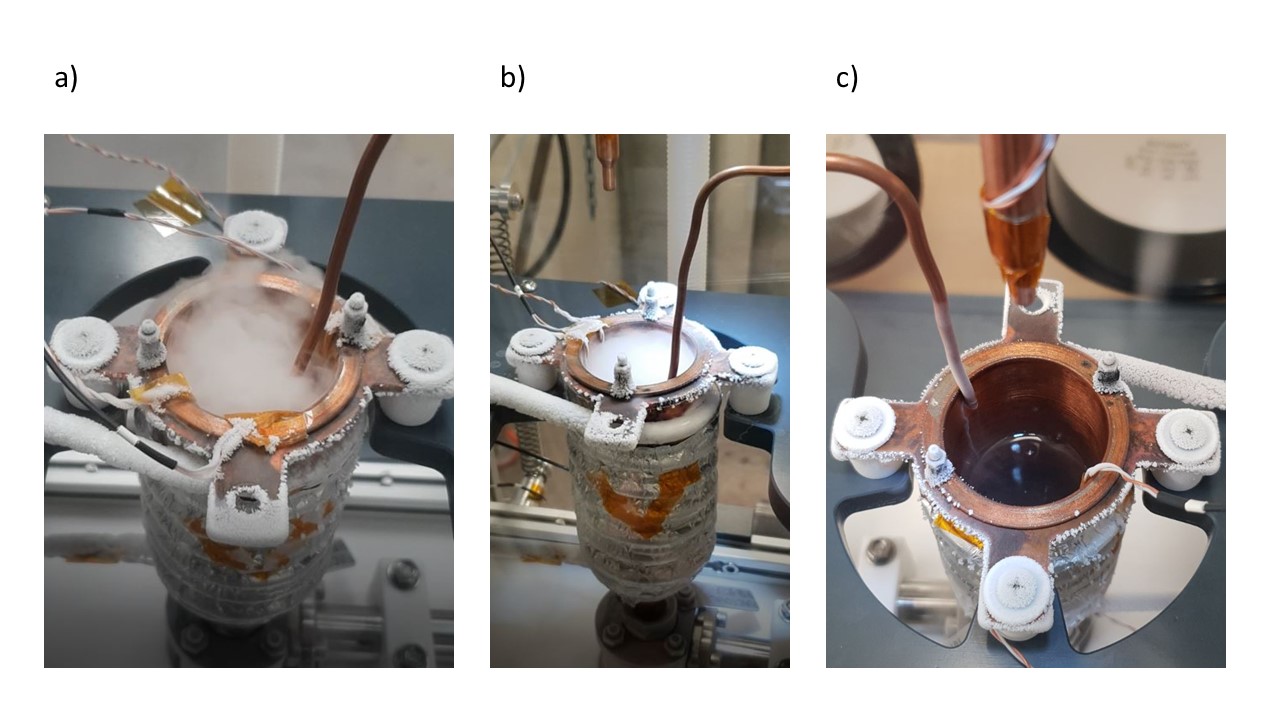
Fig. 15 Ethane liquefaction#
With optimal conditions (look for data), high temperature / high ethane flow, gaseous ethane is directly converted into a liquid and the fog disappear (Figure 15 c)). This allow a direct monitoring of the speed of the liquefaction process. Otherwise we can rely on the Thermocouple data to monitor it. An important decrease in TC1 and TC2 temperature arise when they are submerged by the liquid. Calculation Volume of liquid per time liquefaction speed (comparison …)
TC1 and TC2 have same temperature no thermal gradient at different height good
Frost growing on cold temperature experiment part (corrugated hose …) but not on reaction vessel, cold trap preventing frosting of critical areas.
:::{note} Speak about when temperature high enough, no fume produced. :::
Once enough ethane produced (3cm to the top) volume. Monitored by graduation engraved on Frost shield. Close the valve, ethane bottle first and then the valve on the glove box. Stop of ethane introduction (hot gas) usually result in temperature decreasing, the system needs some time and manipulation to find an equilibrium state.
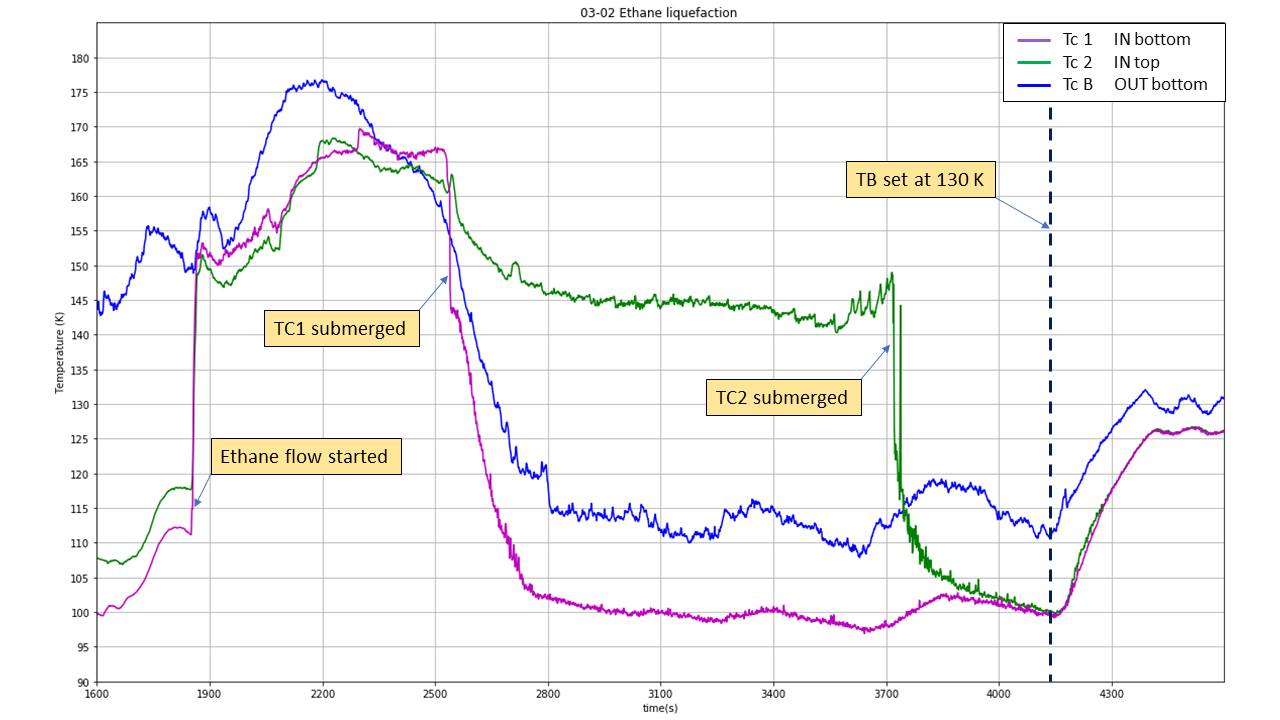
Fig. 16 Ethane liquefaction#
Ethane Temperature control#
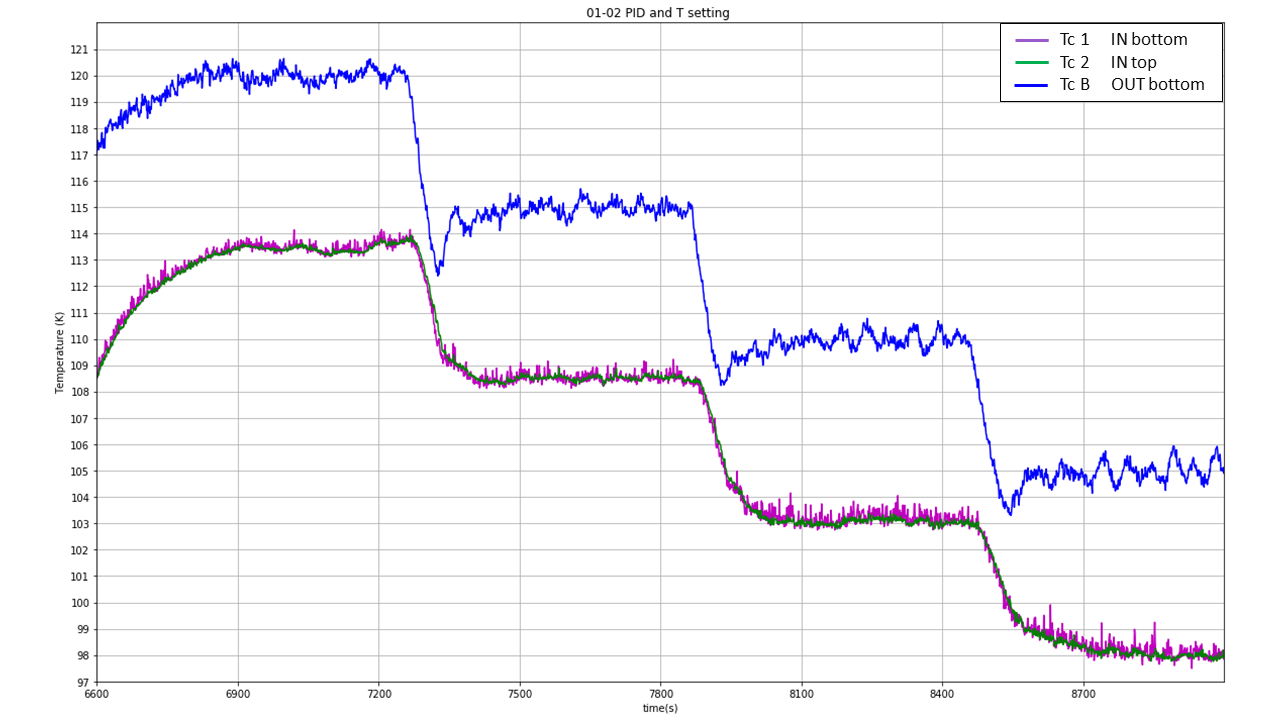
Fig. 17 Temperature setting#
PID settings: TCB used more reliable
Water introduction#
The water droplet introduction phase is relatively similar to the procedure used on the previous proof of concept experiment. First the water reservoir has to be filled with the required amount (10 ml) of deionized water and the top screwed tightly in place. The nebulizer compressor is connected to a 0 grade Nitrogen bottle whose pressure is set up to 0.5 bar. Then the Nebulizer is turned on and this will result in the production of a fine mist of µm droplets.
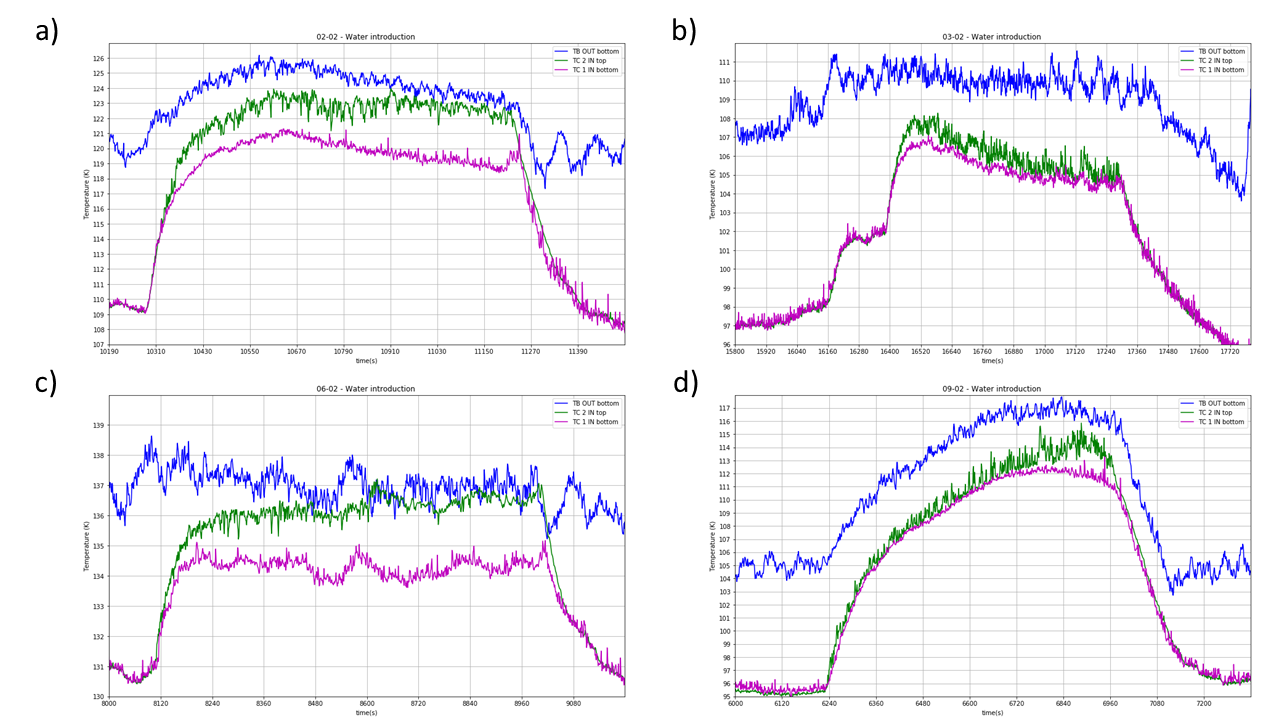
Fig. 18 Water introduction ethane temperature#
The introduction of a hot (20 °C) mixture of gas and water droplets result in an increase of the ethane temperature. TC2 equilibrate higher than TC1. Temperature difference differ with different experimental procedure (base temperature …). Water droplet production required a full attention of the operator in order to avoid big droplets forming by condensation on the on the nozzle to fall into the cryogen. Such droplets are constantly forming and are cleaned by absorption from a Q-tip.
Ice recovery#
Sample storage#
ISIS cell#
Both required use of heat sink to maintain a temperature well below the glace transition of water (137K). Liquid Nitrogen is used to cool down the heat sink. Liquid Nitrogen is filtered and poured through funnel (8 in Figure 5) into a Dewar and then introduced into the sample recovery setup chosen. Time consuming and heavy manipulation task. Must be started during equilibrium phase of ethane liquefaction and temperature adjustment phase. Lots of Nitrogen evaporating during cooling, has an impact on overall temperature within glove box (can reach -10 degrees). Make working conditions more difficult.
Discussion and evaluation#
Improvement
Increasing N2 gas flow going through nebulizer
Anti water condensation coating to prevent condensation
May be use an appropriate nozzle (cf different spray geometry) What minimum sizes can we achieve
Test nozzle + nebulizer flow by spraying with different experimental parameter (pressure) and see penetration depth into liquid with same viscosity as liquid ethane (paraffin oil ?)
Introduce some dust to create a proper Interstellar dust analogue
Find a way to stir and mix the ethane (wider diameter for RV) o Gear system (no electrical equipment) o Create a syphon (kind of) Highly convective system, brough the particles at bottom of RV, Reduce temperature increase due to water introduction
Vary the cryogen, for example mixture of ethane + propane o Lower the boiling point